· Jaroslav Bezdek · Analysis · 9 min read
The NHL Team Rankings: Defense
Which teams gave up the most scoring chances to their opponents during the 2024/25 regular season? And which teams, on the other hand, sacrificed their bodies to block the most shots? Let's find out!

Defense wins championships—or so the saying goes. As the 2024/2025 regular season winds down, it’s time to look beyond the goals and highlight the teams that excel at keeping pucks out of their own net. In this article, we dive into the defense rankings to identify which NHL teams managed to protect their own net the best.
Defense Related Statistics
Just like with offense, a combination of advanced statistics paints a much clearer picture than one single stat alone. Here’s what went into the Defense Score.
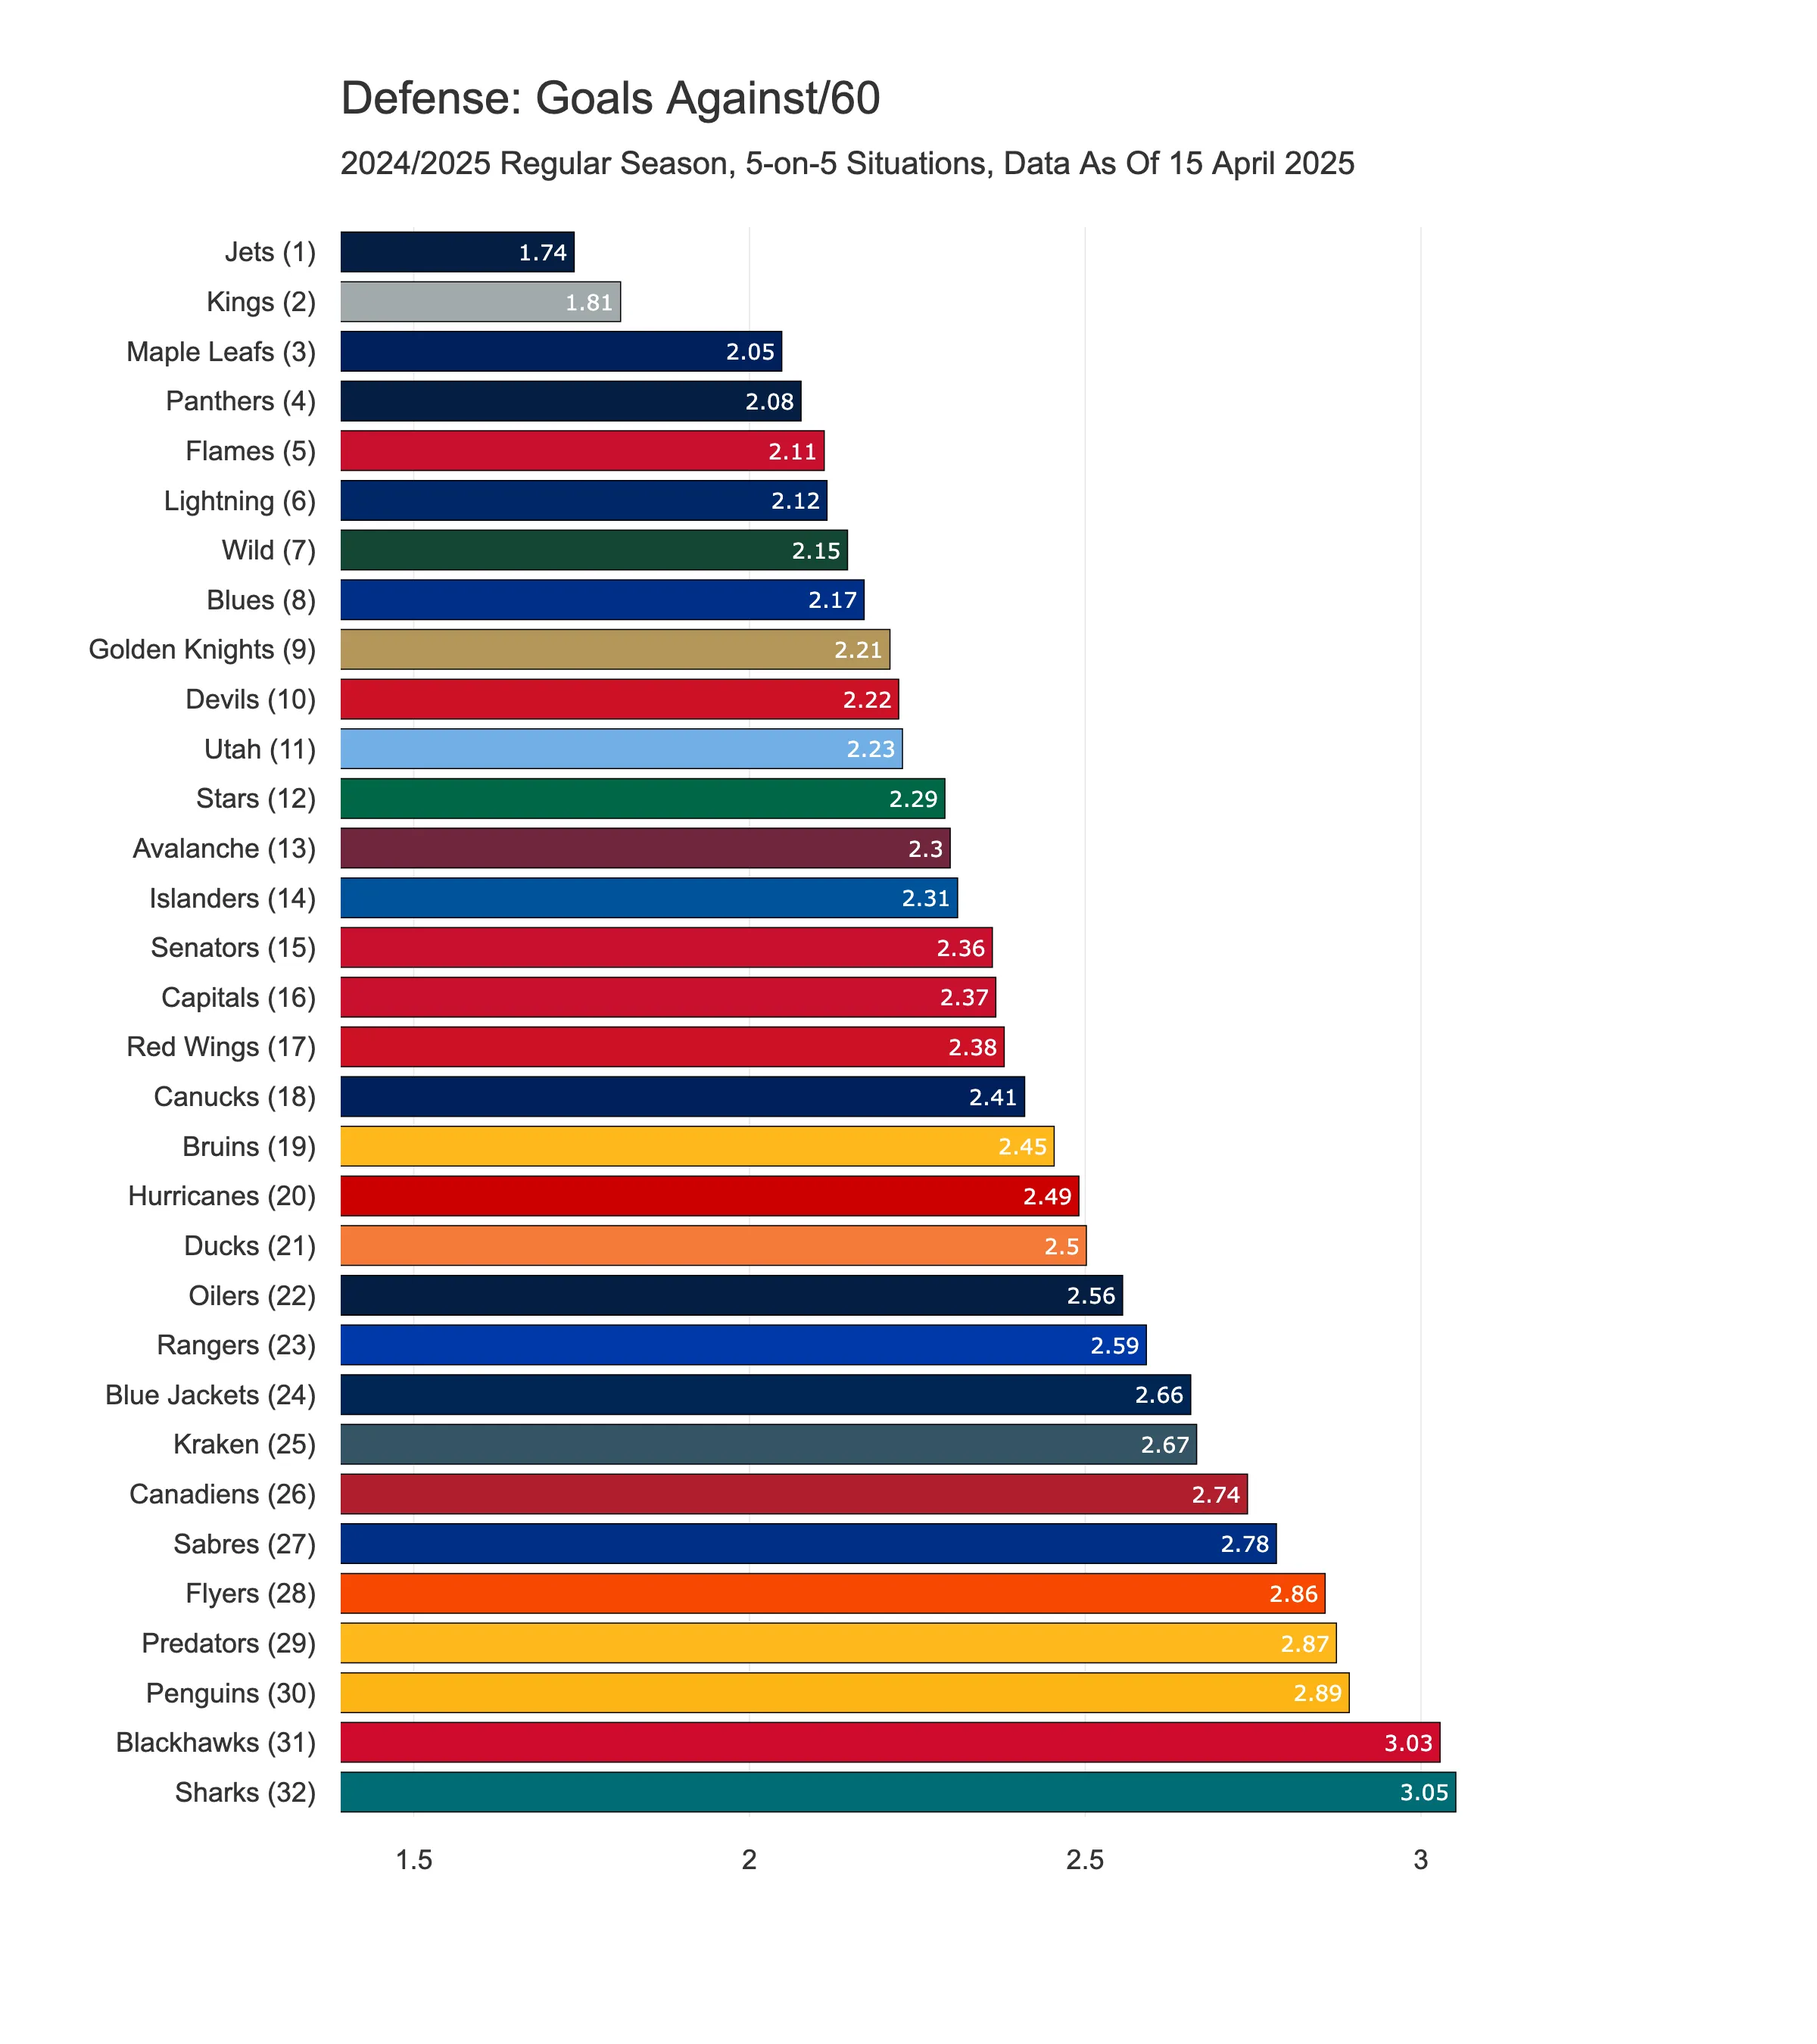
1) Goals Against/60
This is the first of a few counter parts from offense rainking that shows how many goals a team concedes per 60 minutes at 5-on-5.
From the chart below, we can see that the Jets allowed the fewest goals, followed by the Kings, Maple Leafs, Panthers, and Flames. It’s clear that some of these teams likely rely heavily on goaltending, which helps explain their high ranking in this statistic. And that’s reasonable. While Goals Against/60 isn’t a purely defensive stat—since it’s influenced by other factors—it still provides a solid indication of a team’s defensive performance. The logic behind this metric is straightforward: the stronger the defense, the fewer goals a team will give up. For that reason, I decided to include it as part of the overall defensive score.
Next, let’s take a look at additional statistics that could help us to better understand each team’s defensive performance.
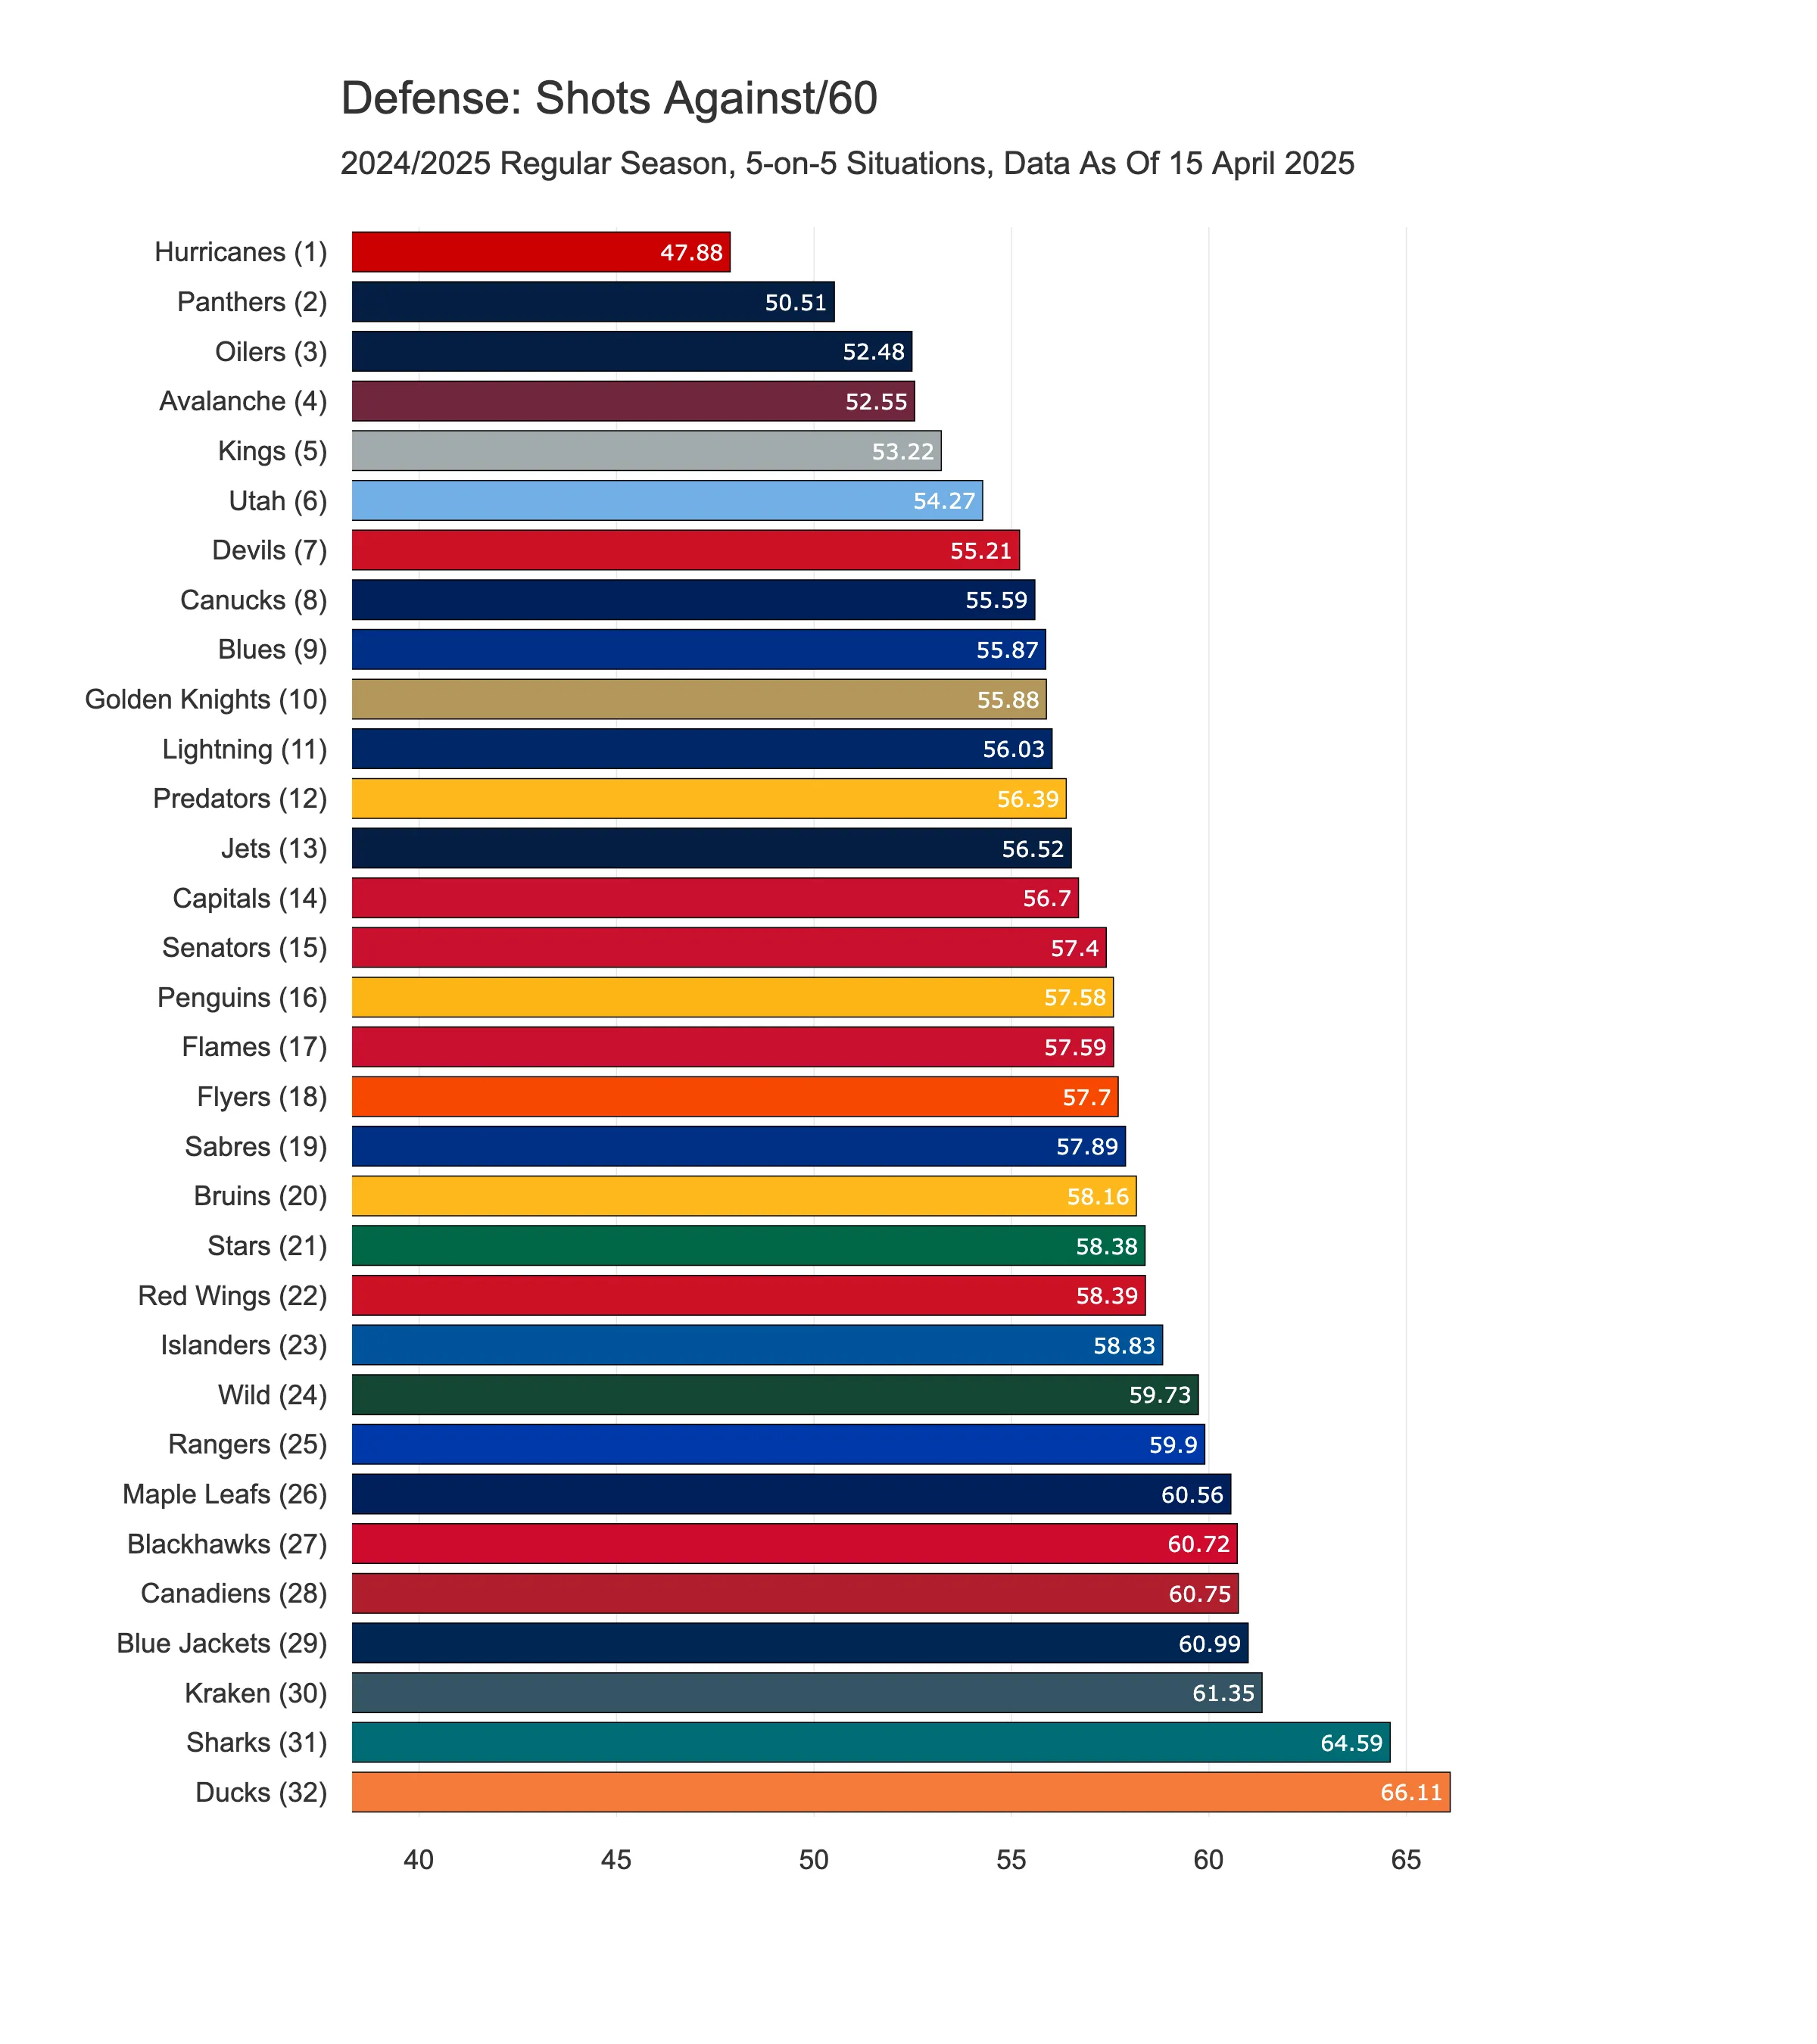
2) Shots Against/60
This stat tracks how often opponents generate shots. Looking at the chart below, it’s evident that not all teams that allow the fewest goals are also the ones giving up the fewest shots. The Jets dropped from 1st to 13th, the Lightning from 6th to 11th, and the Maple Leafs fell from 3rd to 26th! The only teams from the original top five that remain near the top are the Kings and Panthers.
However, this doesn’t necessarily mean that the teams which dropped are weak defensively. We don’t yet know the quality of the shots they were allowing. Still, at first glance, it seems these teams rely more on goaltending than on defensive structure to keep the puck out of their net.
In contrast, teams like the Kings and Panthers, which rank highly in both metrics, appear to be strong defensively in general.
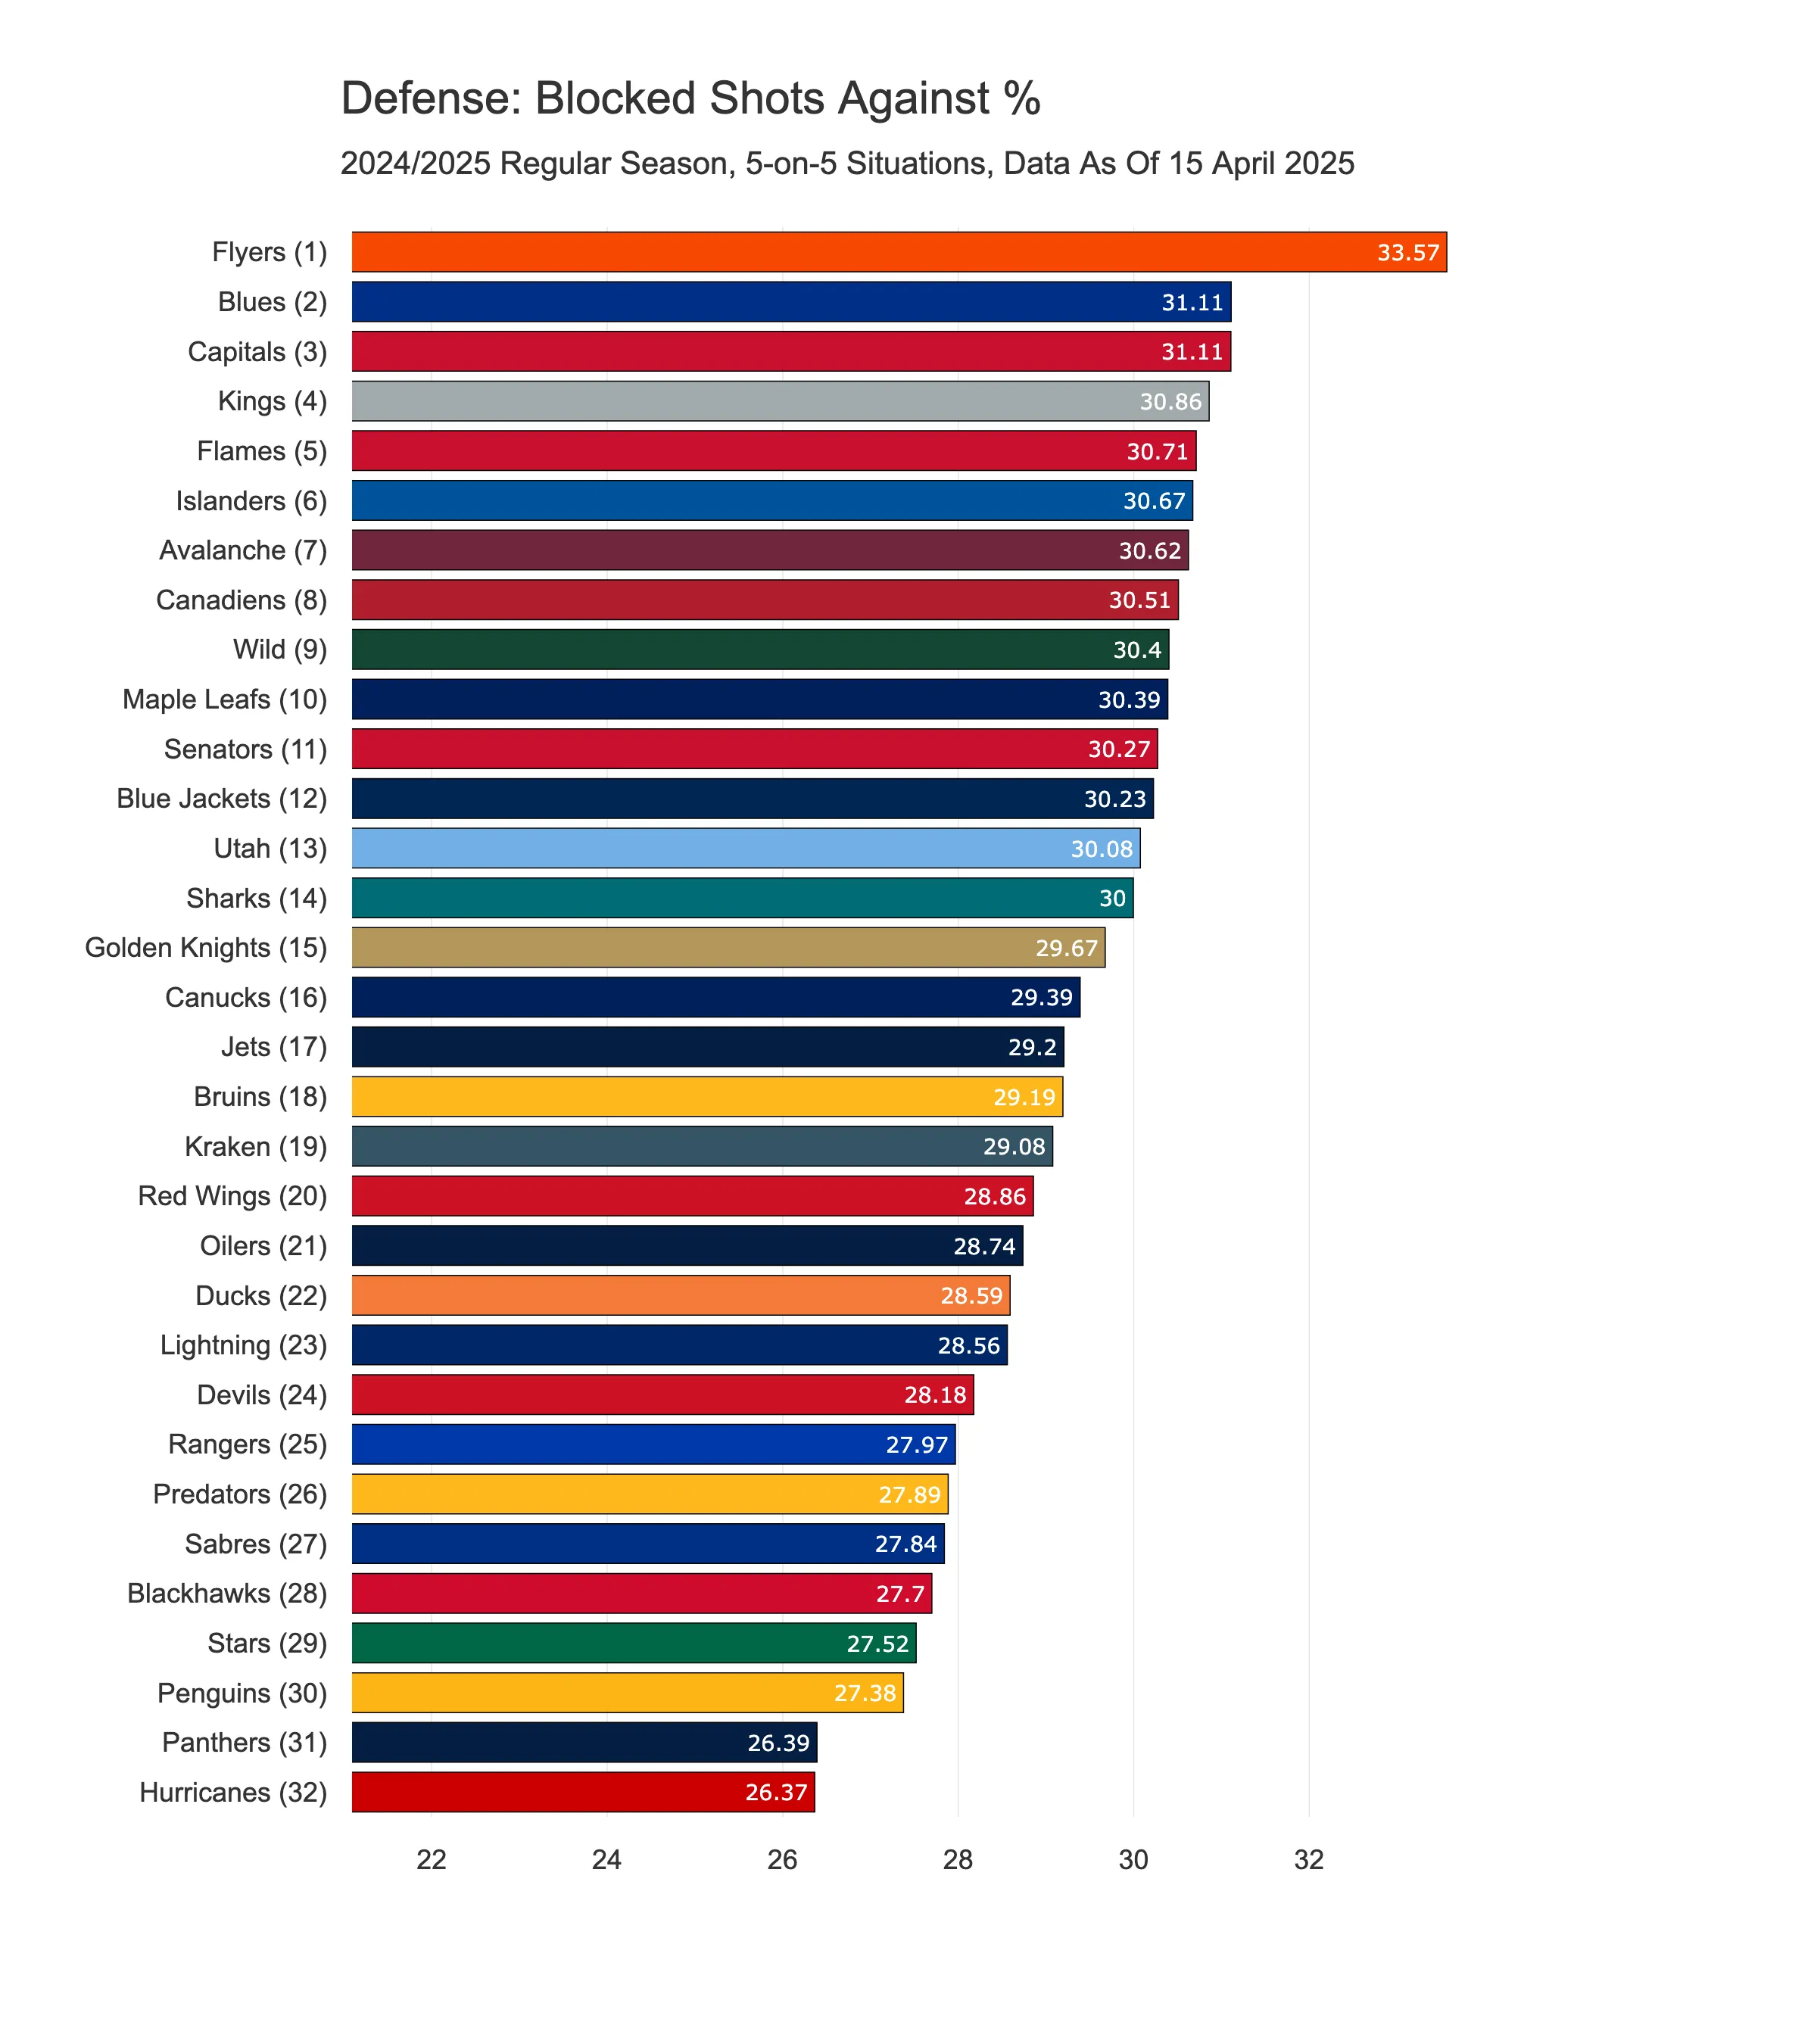
3) Blocked Shots Against %
When it comes to individual player stats, people often focus on the total number of blocked shots by defencemen. But those numbers don’t really allow for fair comparison—players have different amounts of ice time and face different volumes of shots. That’s why percentages are a better metric here; they show what proportion of shots a player managed to block out of all the ones taken while they were actually on the ice. I think this works well as a team-level stat too, so I’ve included it as part of the overall defensive score. In short, this figure reflects the percentage of shots a team managed to block during 5-on-5 play.
The team that really stands out in this metric is the Flyers. And even though they didn’t have the best season overall, this ranking actually makes a lot of sense. For most of the year, they were coached by John Tortorella—one of the most recognisable names in the NHL—who’s known for demanding strong team defence and a willingness to block shots. His sides are typically tough to play against and well-drilled in their own end. And that’s exactly what we’re seeing here.
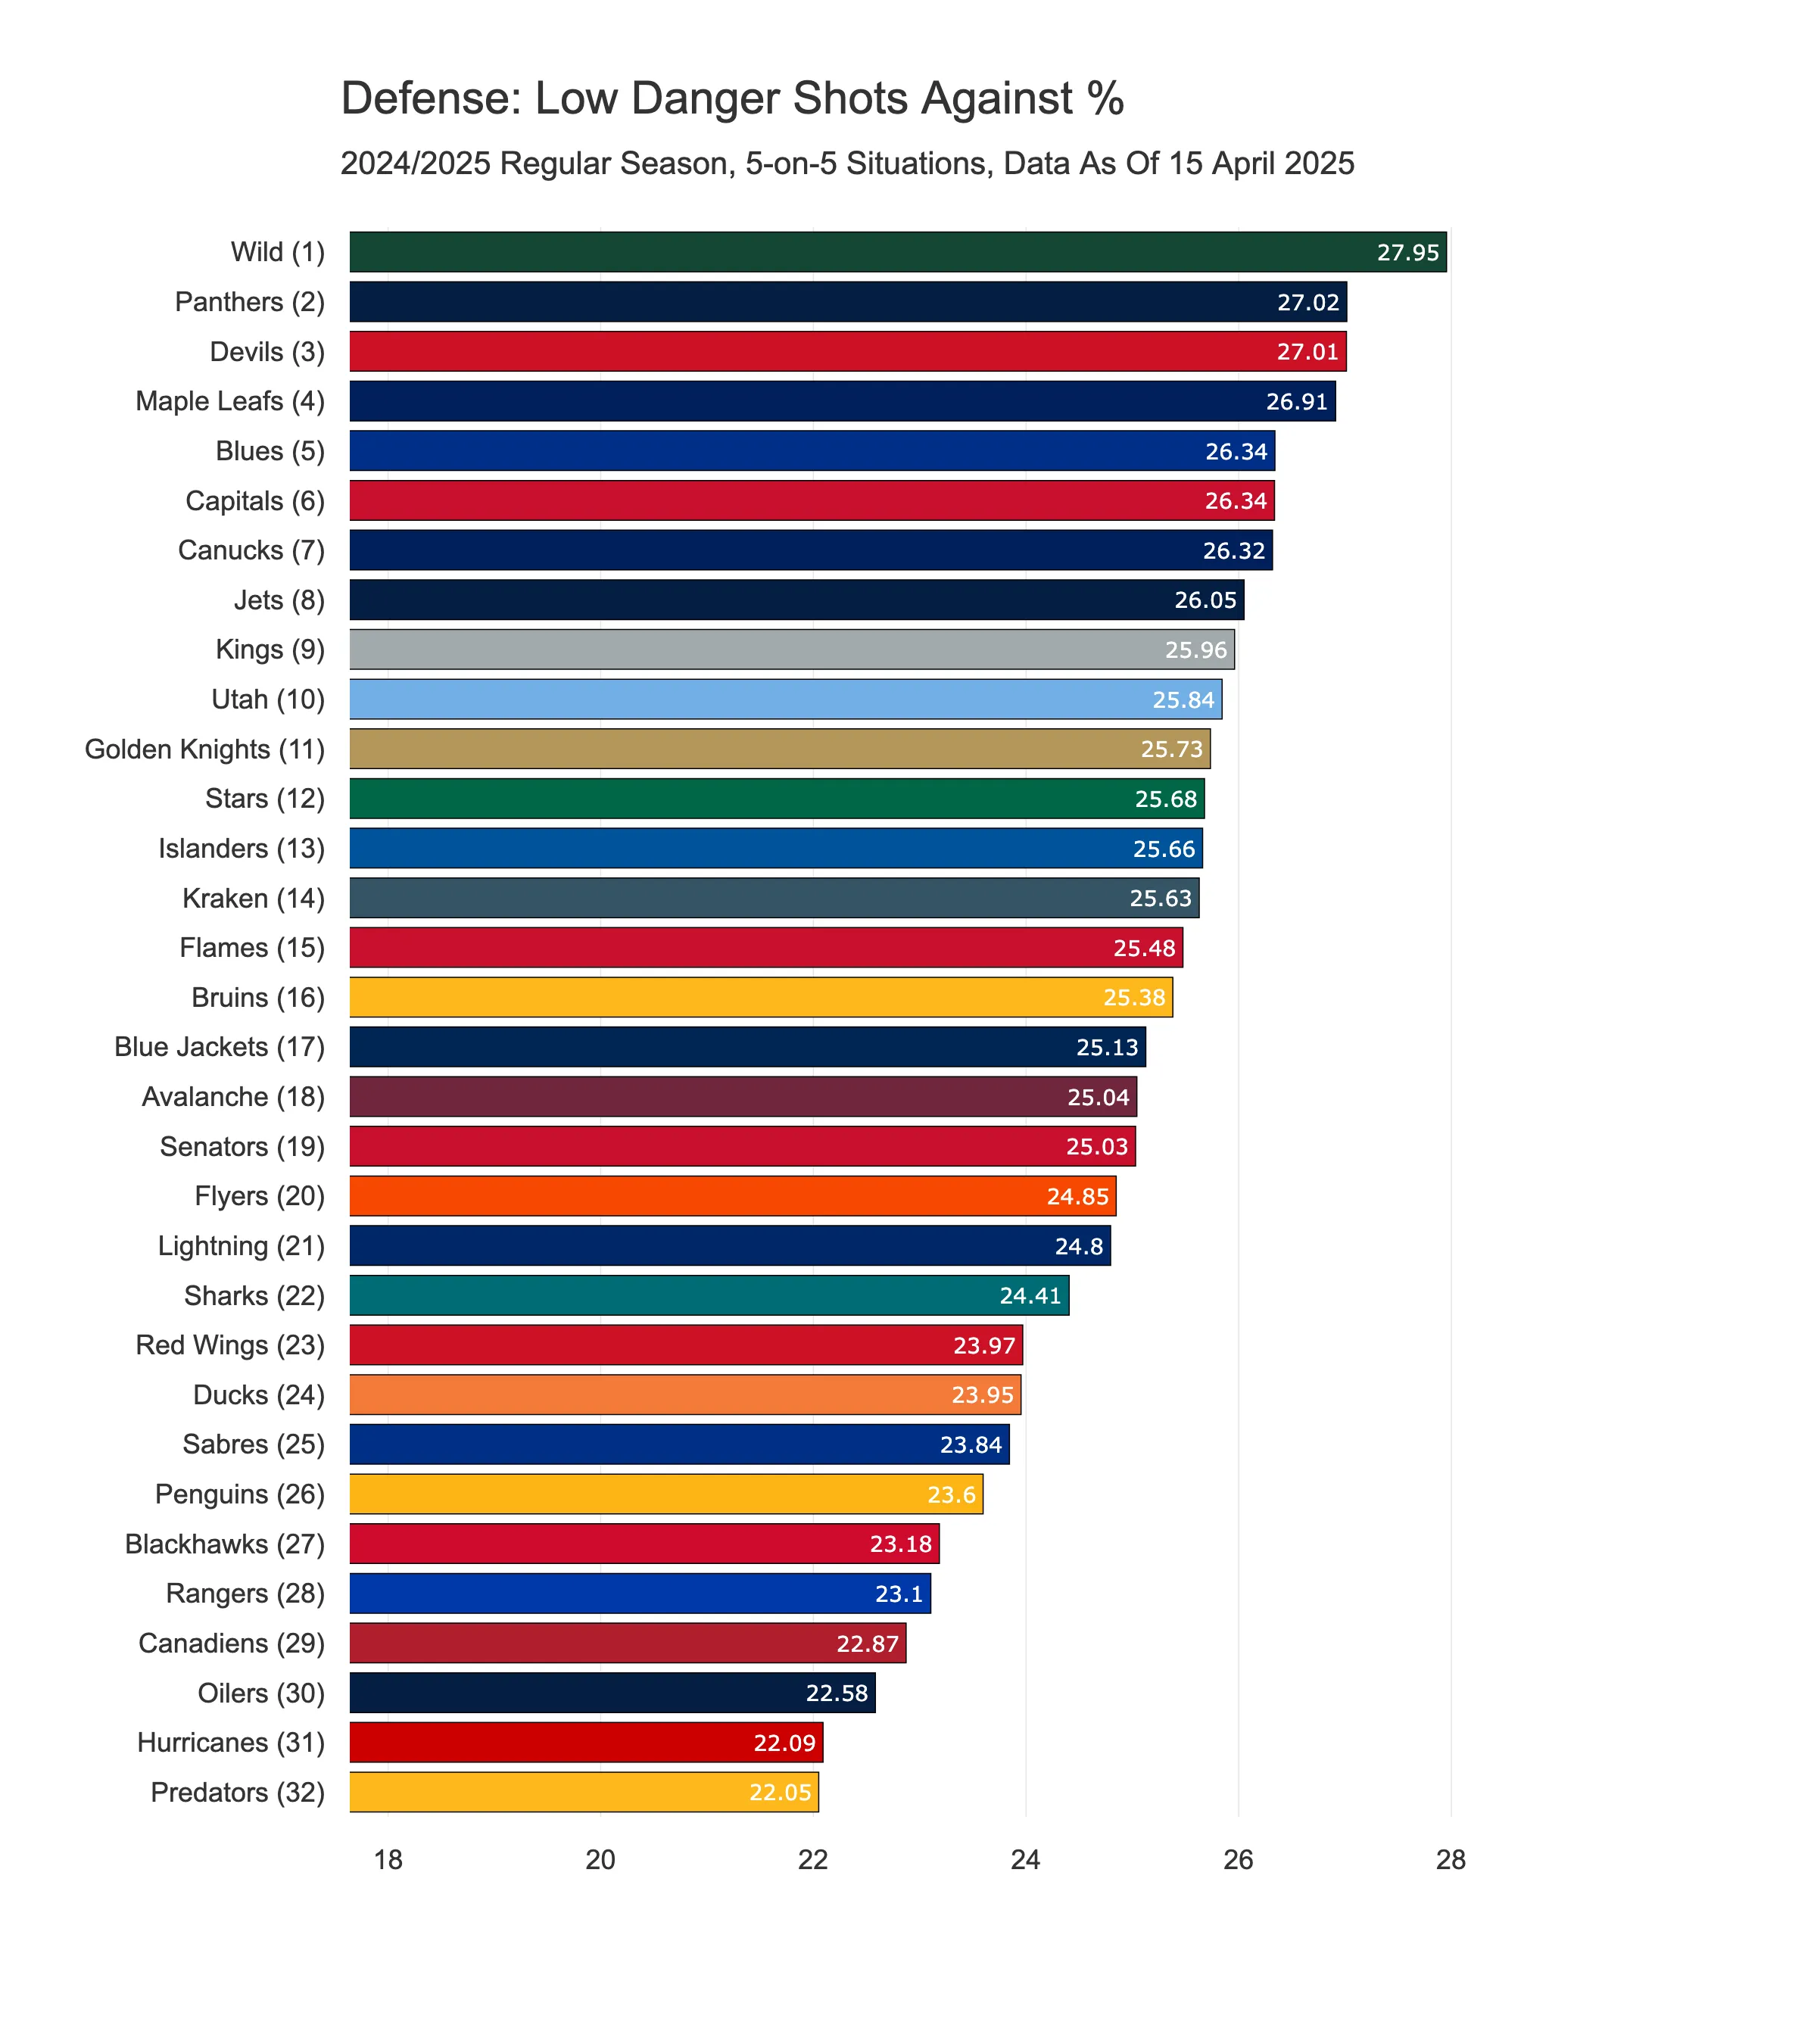
4) Low Danger Shots Against %
This is another counter part from offense ranking, where we look at share of opponent shots that come from low-danger areas. A higher value suggests a team is forcing opponents to settle for poor chances.
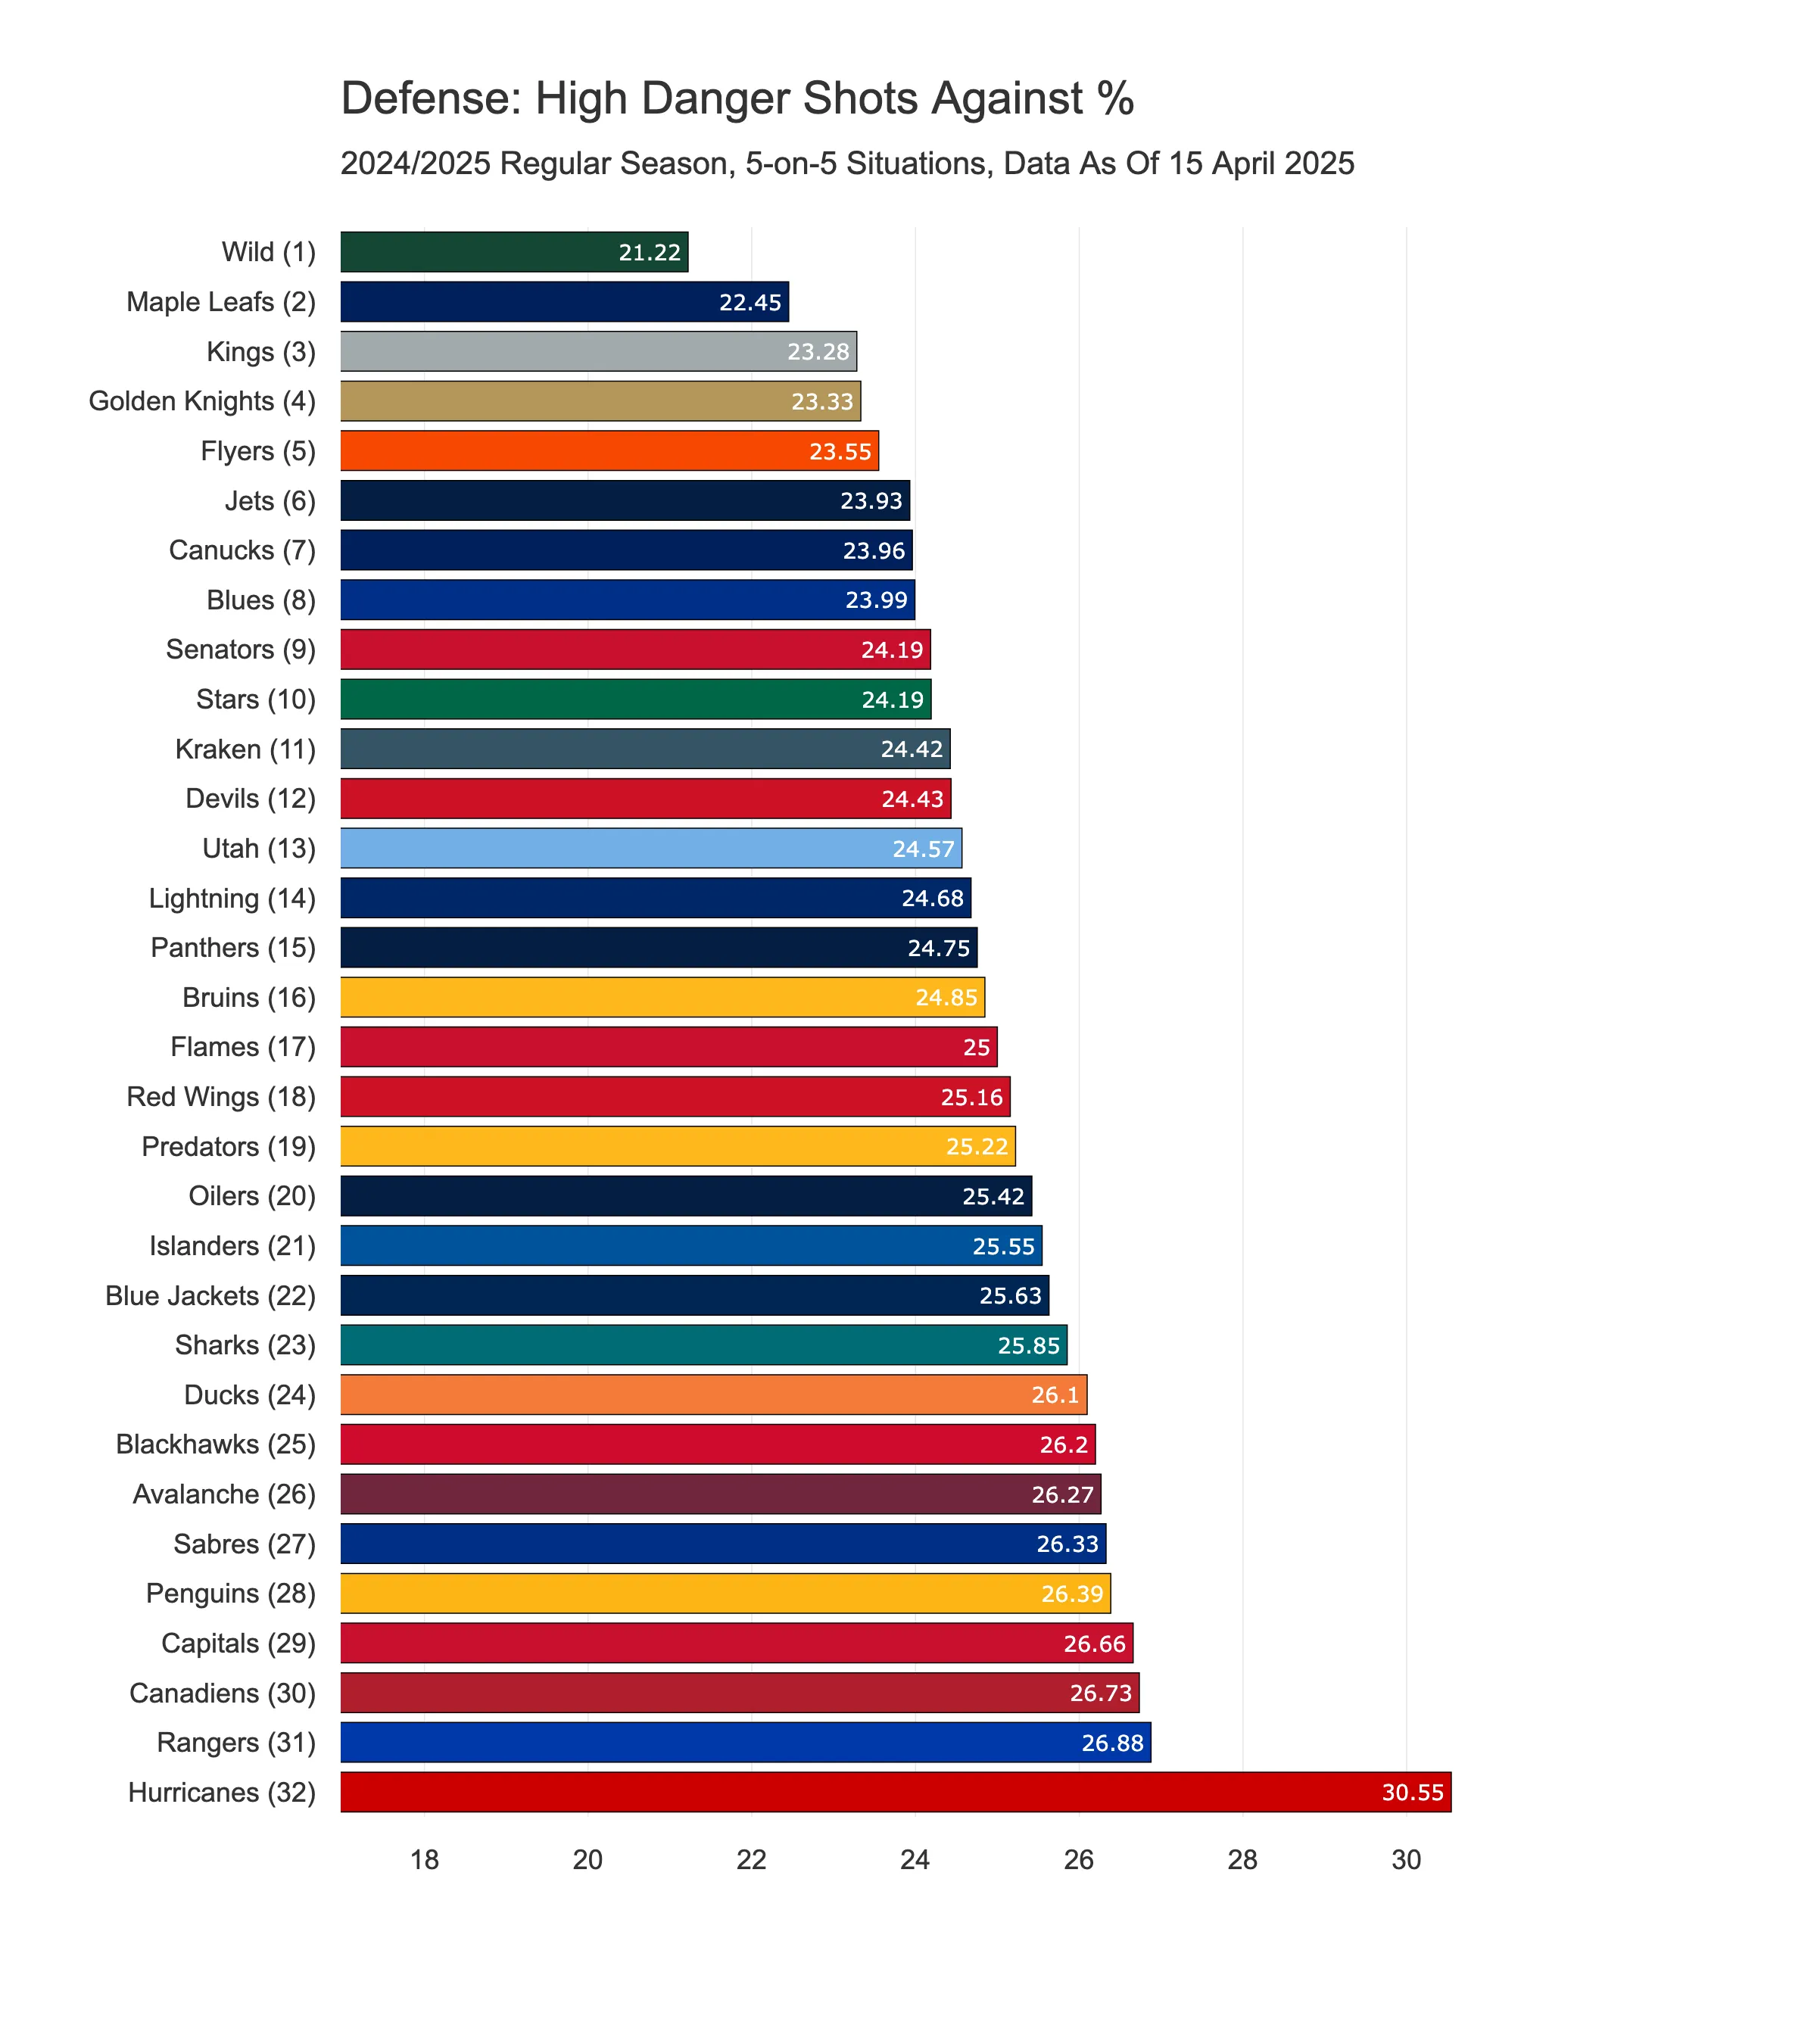
5) High Danger Shots Against %
In contrast to low-danger shots, this metric shows the percentage of opponent shots that come from high-danger areas. The lower the number, the better—it means the team is doing a solid job of protecting the slot.
And we can clearly see two teams standing out across both these metrics: the Wild and the Maple Leafs. We already mentioned the Leafs earlier as a team that concedes relatively few goals despite allowing a lot of shots. At the time, we weren’t sure how dangerous those shots actually were. But now we can see that, in terms of shot quality, they’re doing a great job—they simply don’t allow many high-quality chances. That likely explains why they rank so well in terms of goals against: they’re letting their opponents shoot, but not from threatening areas.
The story is quite similar for the team from Minnesota. They rank 7th in goals against, 24th in shots against, but are 1st in both allowing low-danger and high-danger shots. They might allow volume, but they’re extremely effective at keeping opponents to low-quality areas.
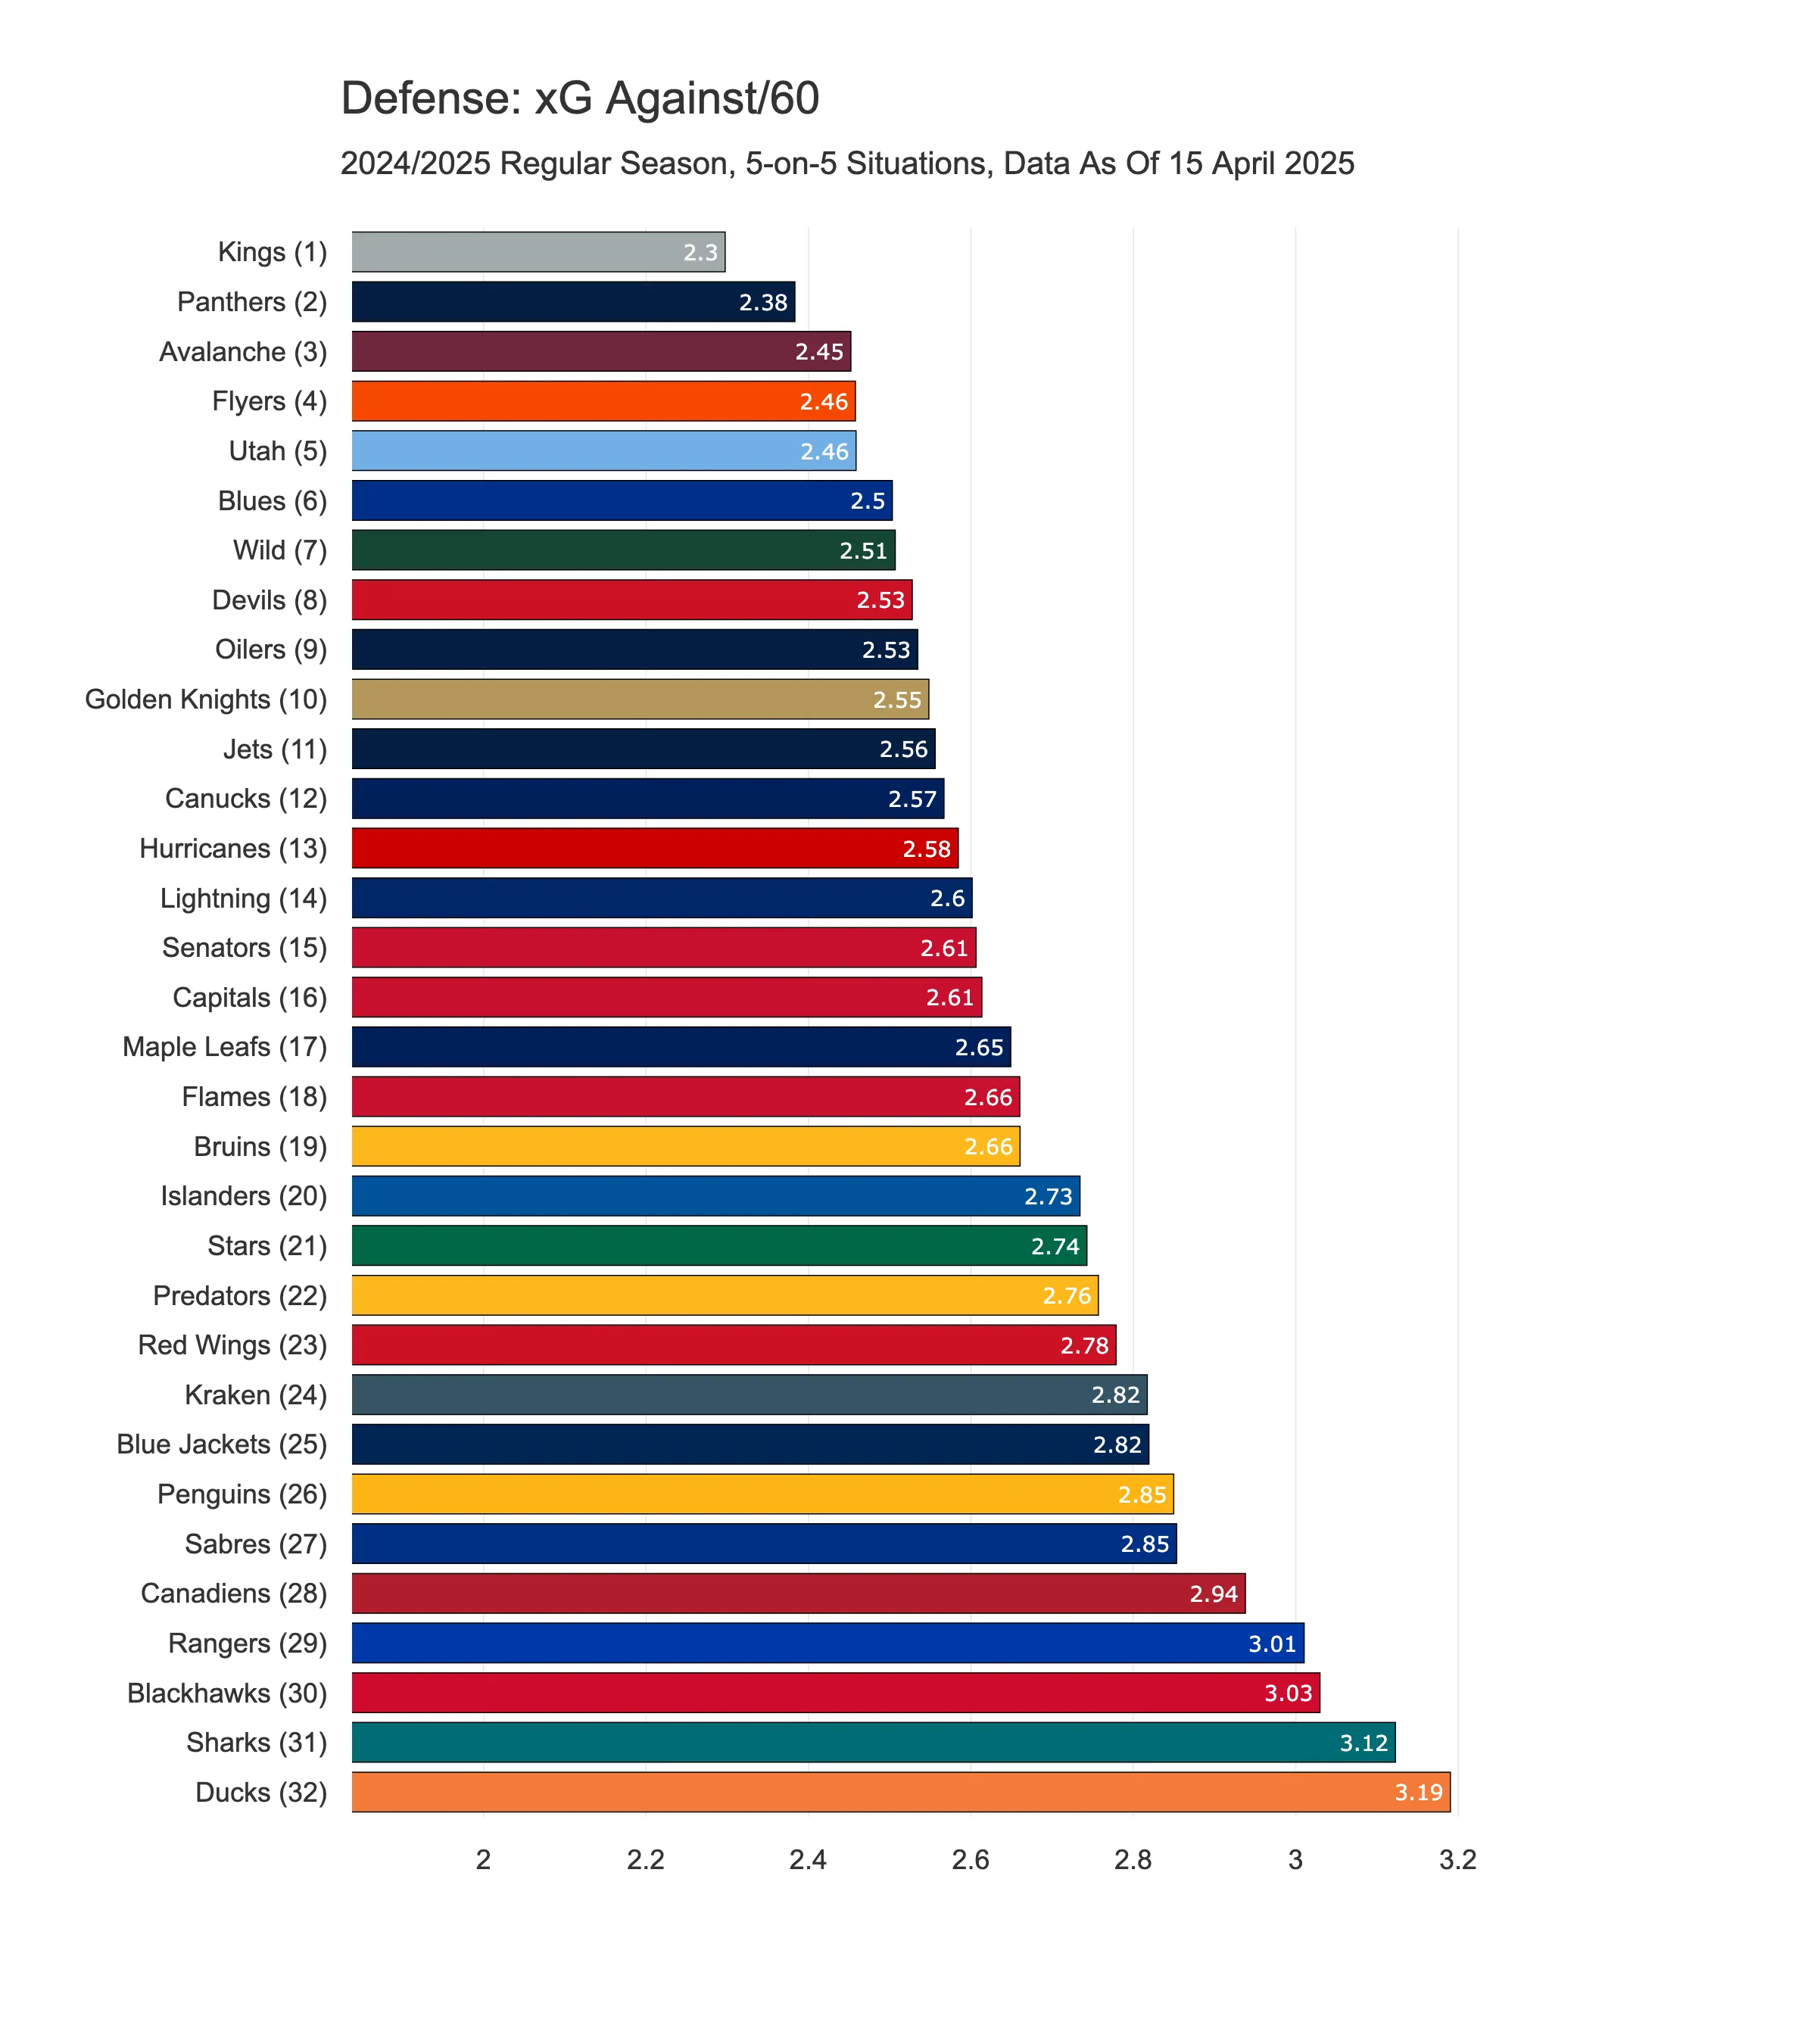
6) Expected Goals Against per 60
This metric normalizes expected goals against by the amount of playing time. It tells us how many expected goals a team would give up in a typical 60-minute period, regardless of how many shots they face.
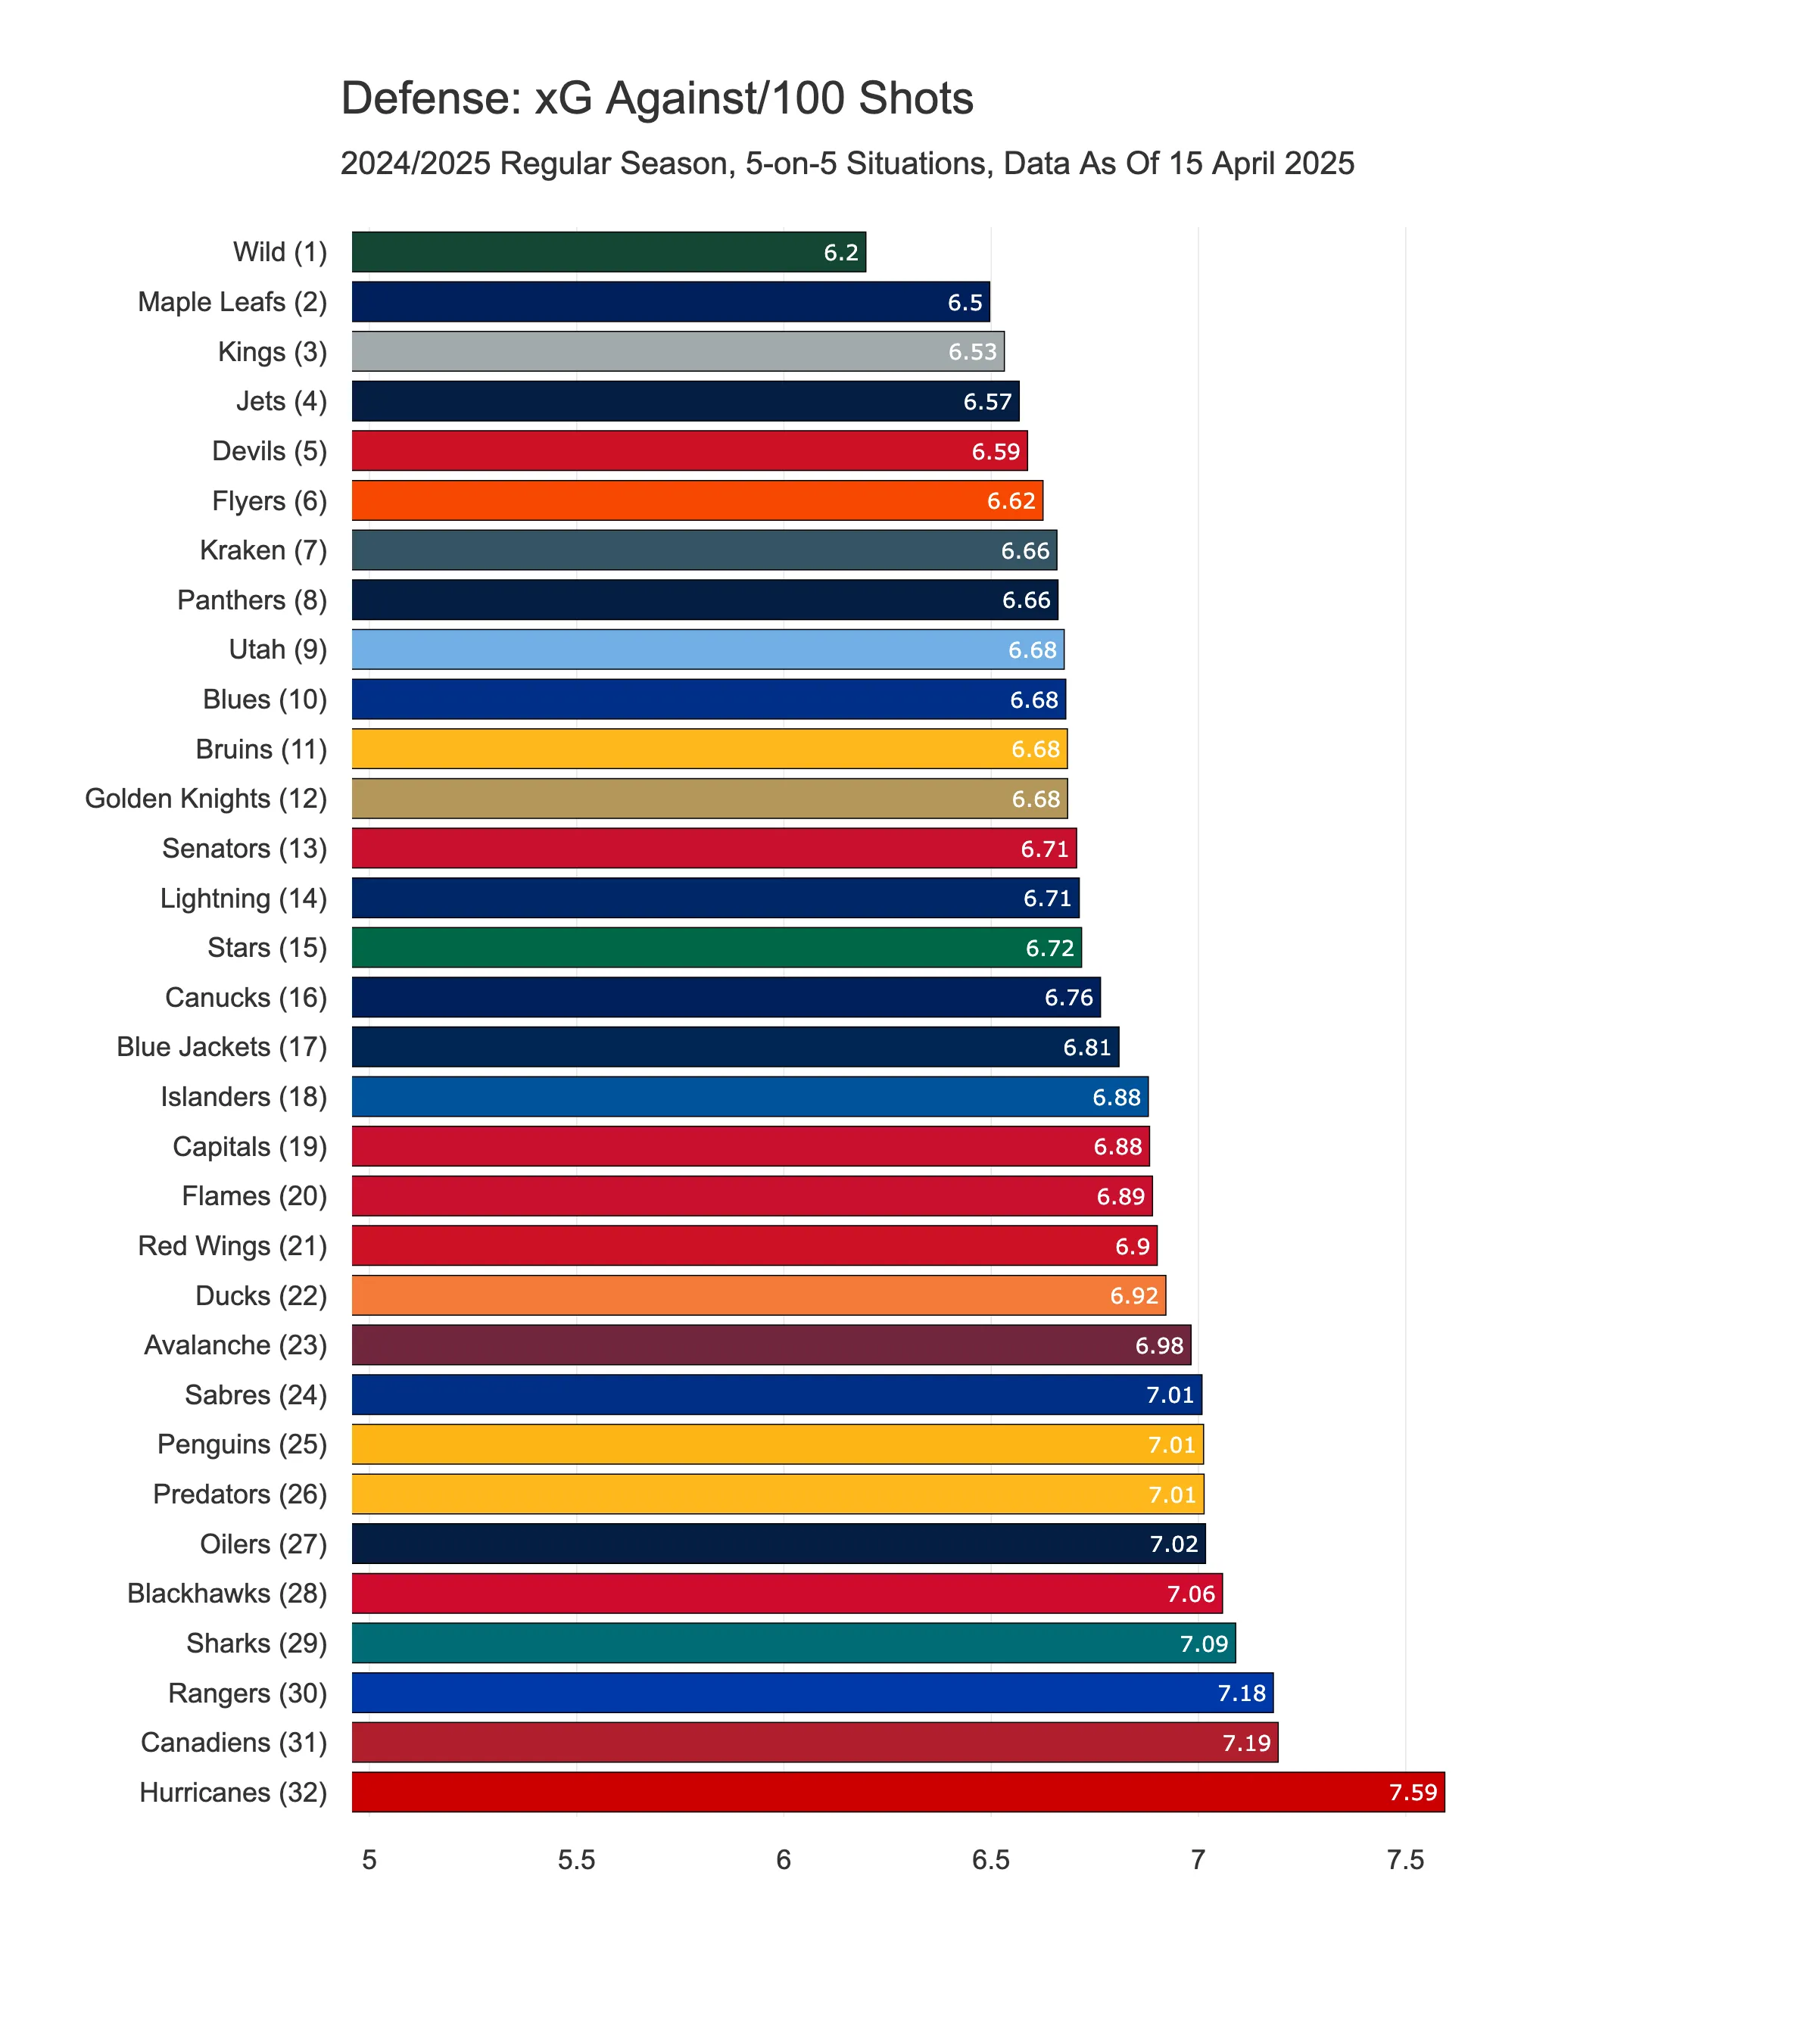
7) Expected Goals Against per 100 Shots
Since Expected Goals Against per 60 is a measure of overall performance regardless of volume, I decided to add the Expected Goals Against per 100 Shots into defense score calculation as well. This metric normalizes expected goals against by the volume of shots faced, and effectively measures the quality or danger of the shots a team allows. A higher number here suggests that, per shot, the quality of the opponent’s scoring chances is higher.
Because the denominators of the two metrics differ (time vs. shot count), the two metrics can tell quite different stories about a team’s defence. Two great examples are the Maple Leafs and the Avalanche. The Maple Leafs have a relatively high xGA/60 but a low xGA/100 Shots - which only proves our previous theory that they’re facing a lot of shots, but those shots aren’t particularly dangerous. The Avalanche, on the other hand, have a low xGA/60 but a high xGA/100 Shots - so they’re giving up fewer shots overall, but when they do, they tend to be high-quality chances.
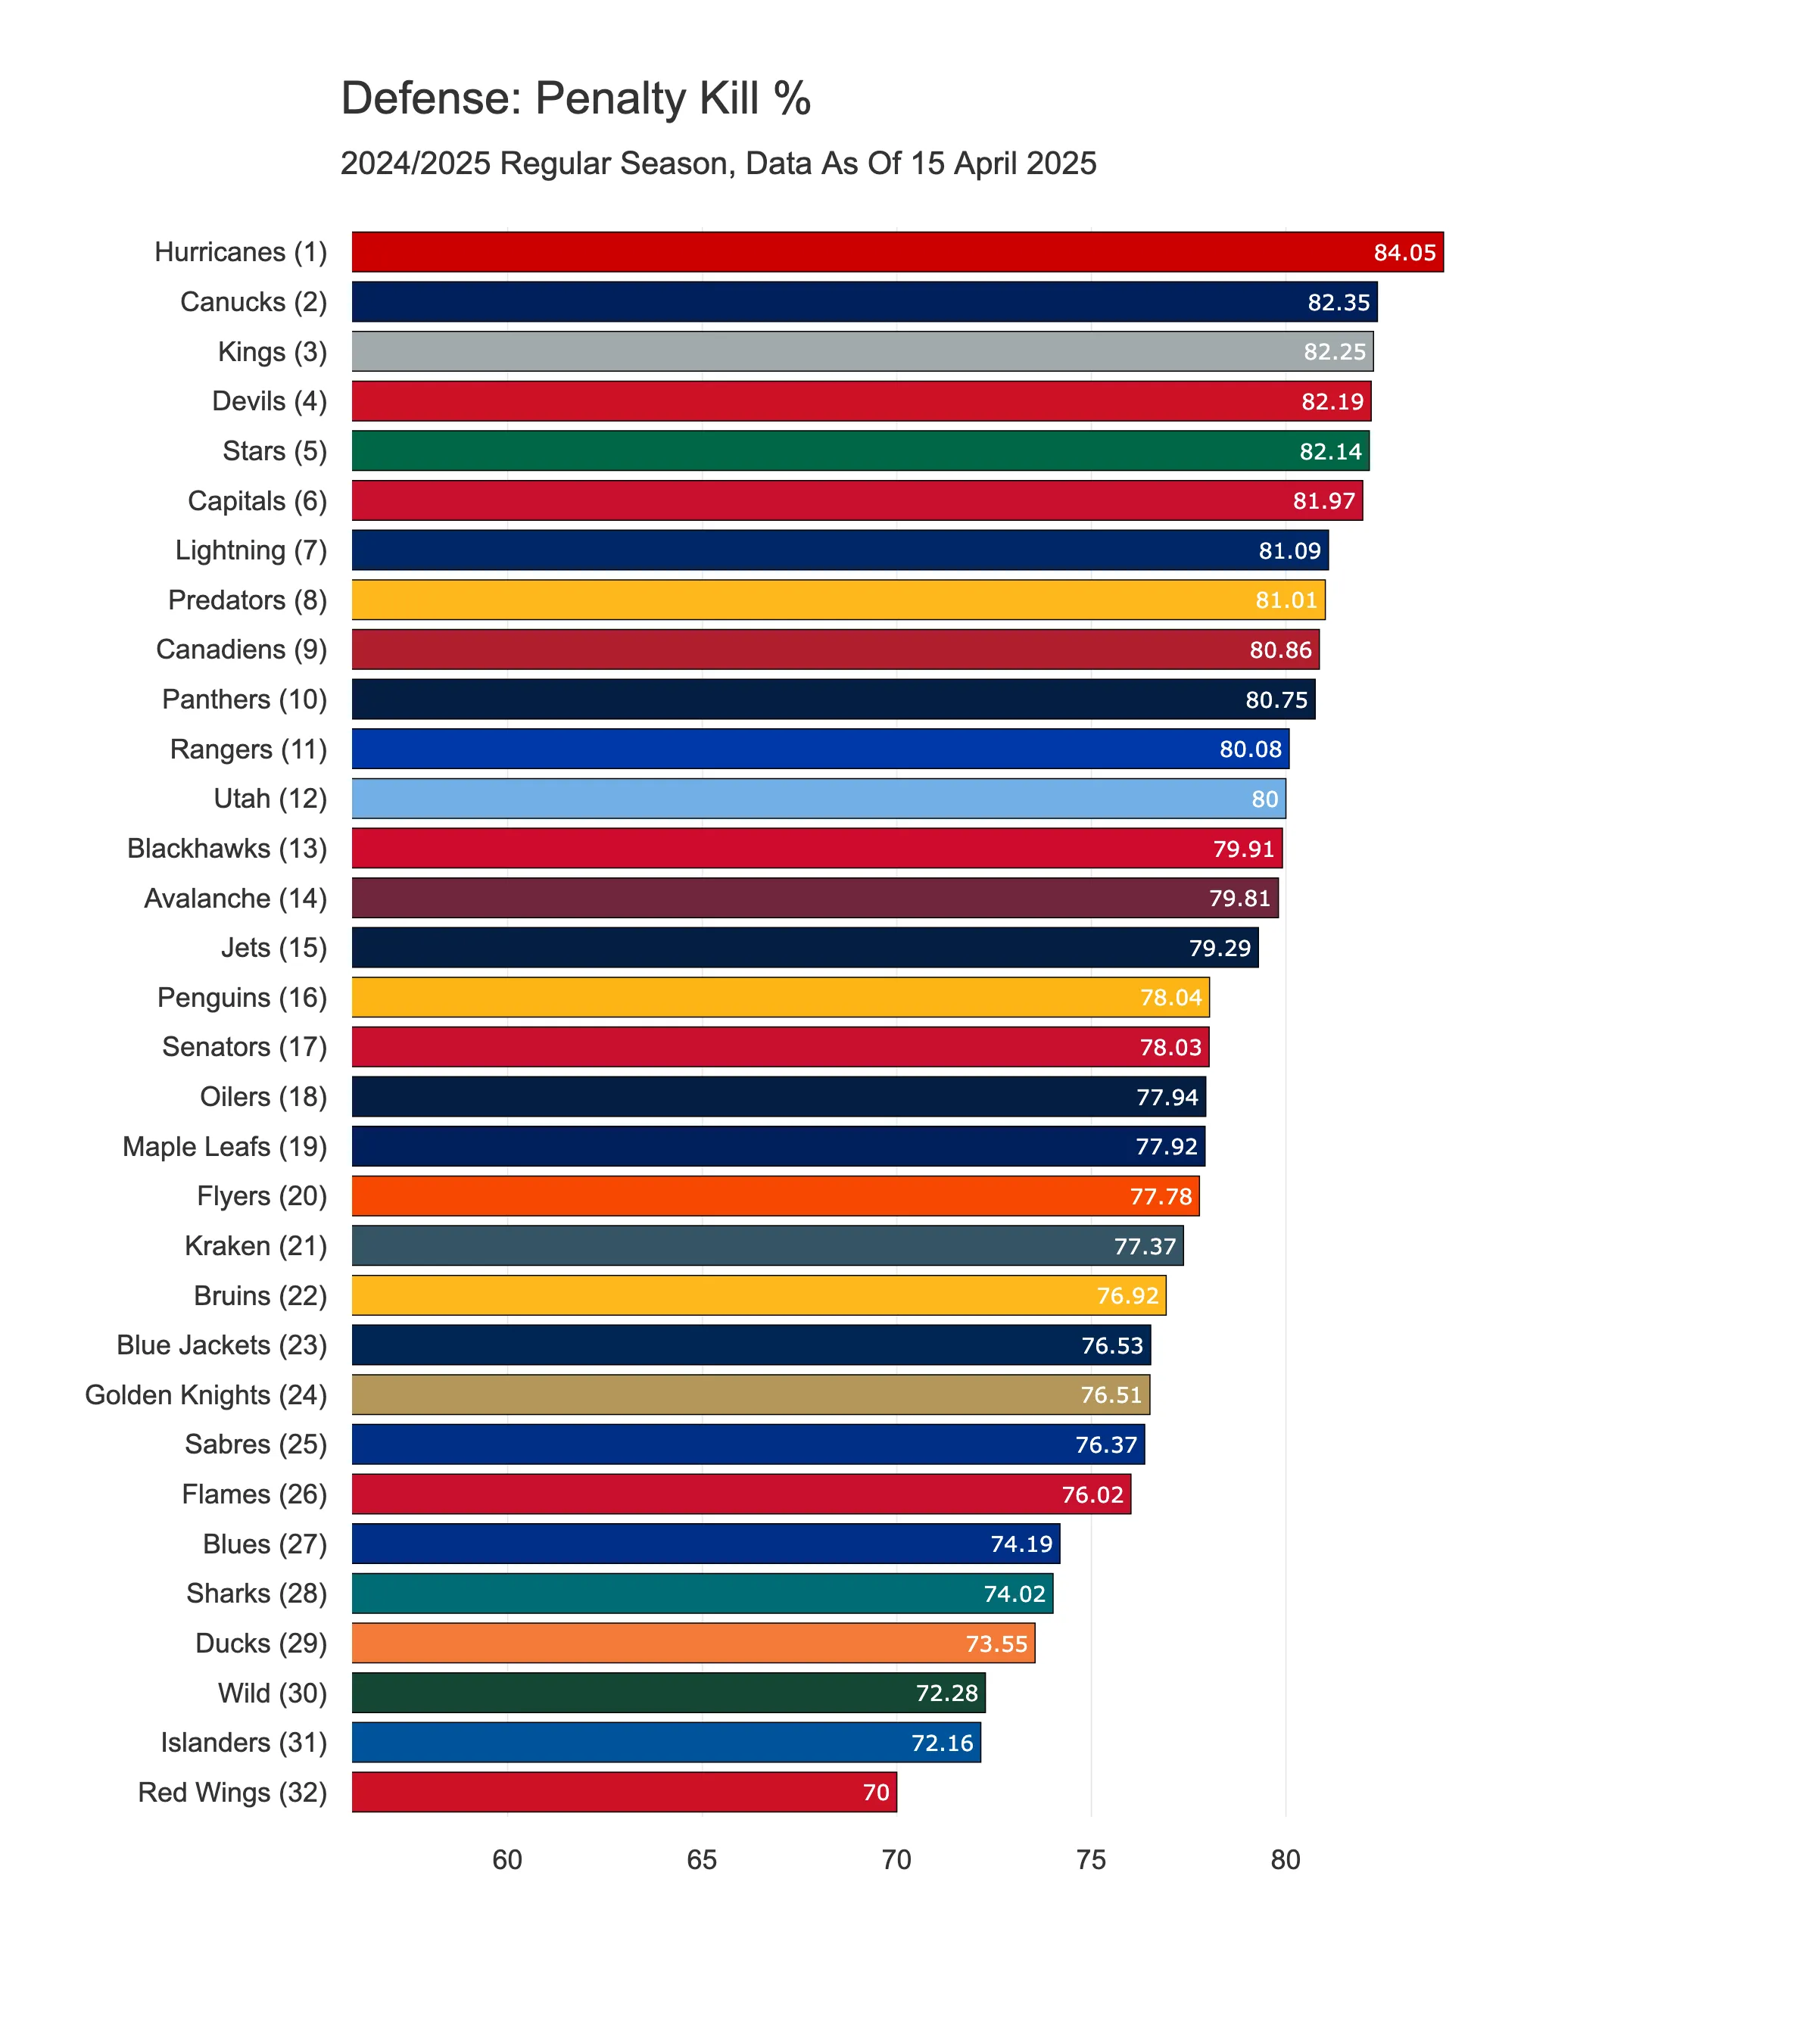
8) Penalty Kill %
Even though the penalty kill isn’t part of 5-on-5 play, I think it’s more than fair to include it in the overall defensive score.
The chart below paints quite an interesting picture. While we previously praised the Wild for certain aspects of their defense, the same can’t be said for their penalty killing. They ranked 30th in this area—only the Islanders and the Red Wings performed worse. If you remember the power play rankings from the previous article, you might recall that the Islanders struggled there too, which suggests they’ve had a tough time on special teams this season.
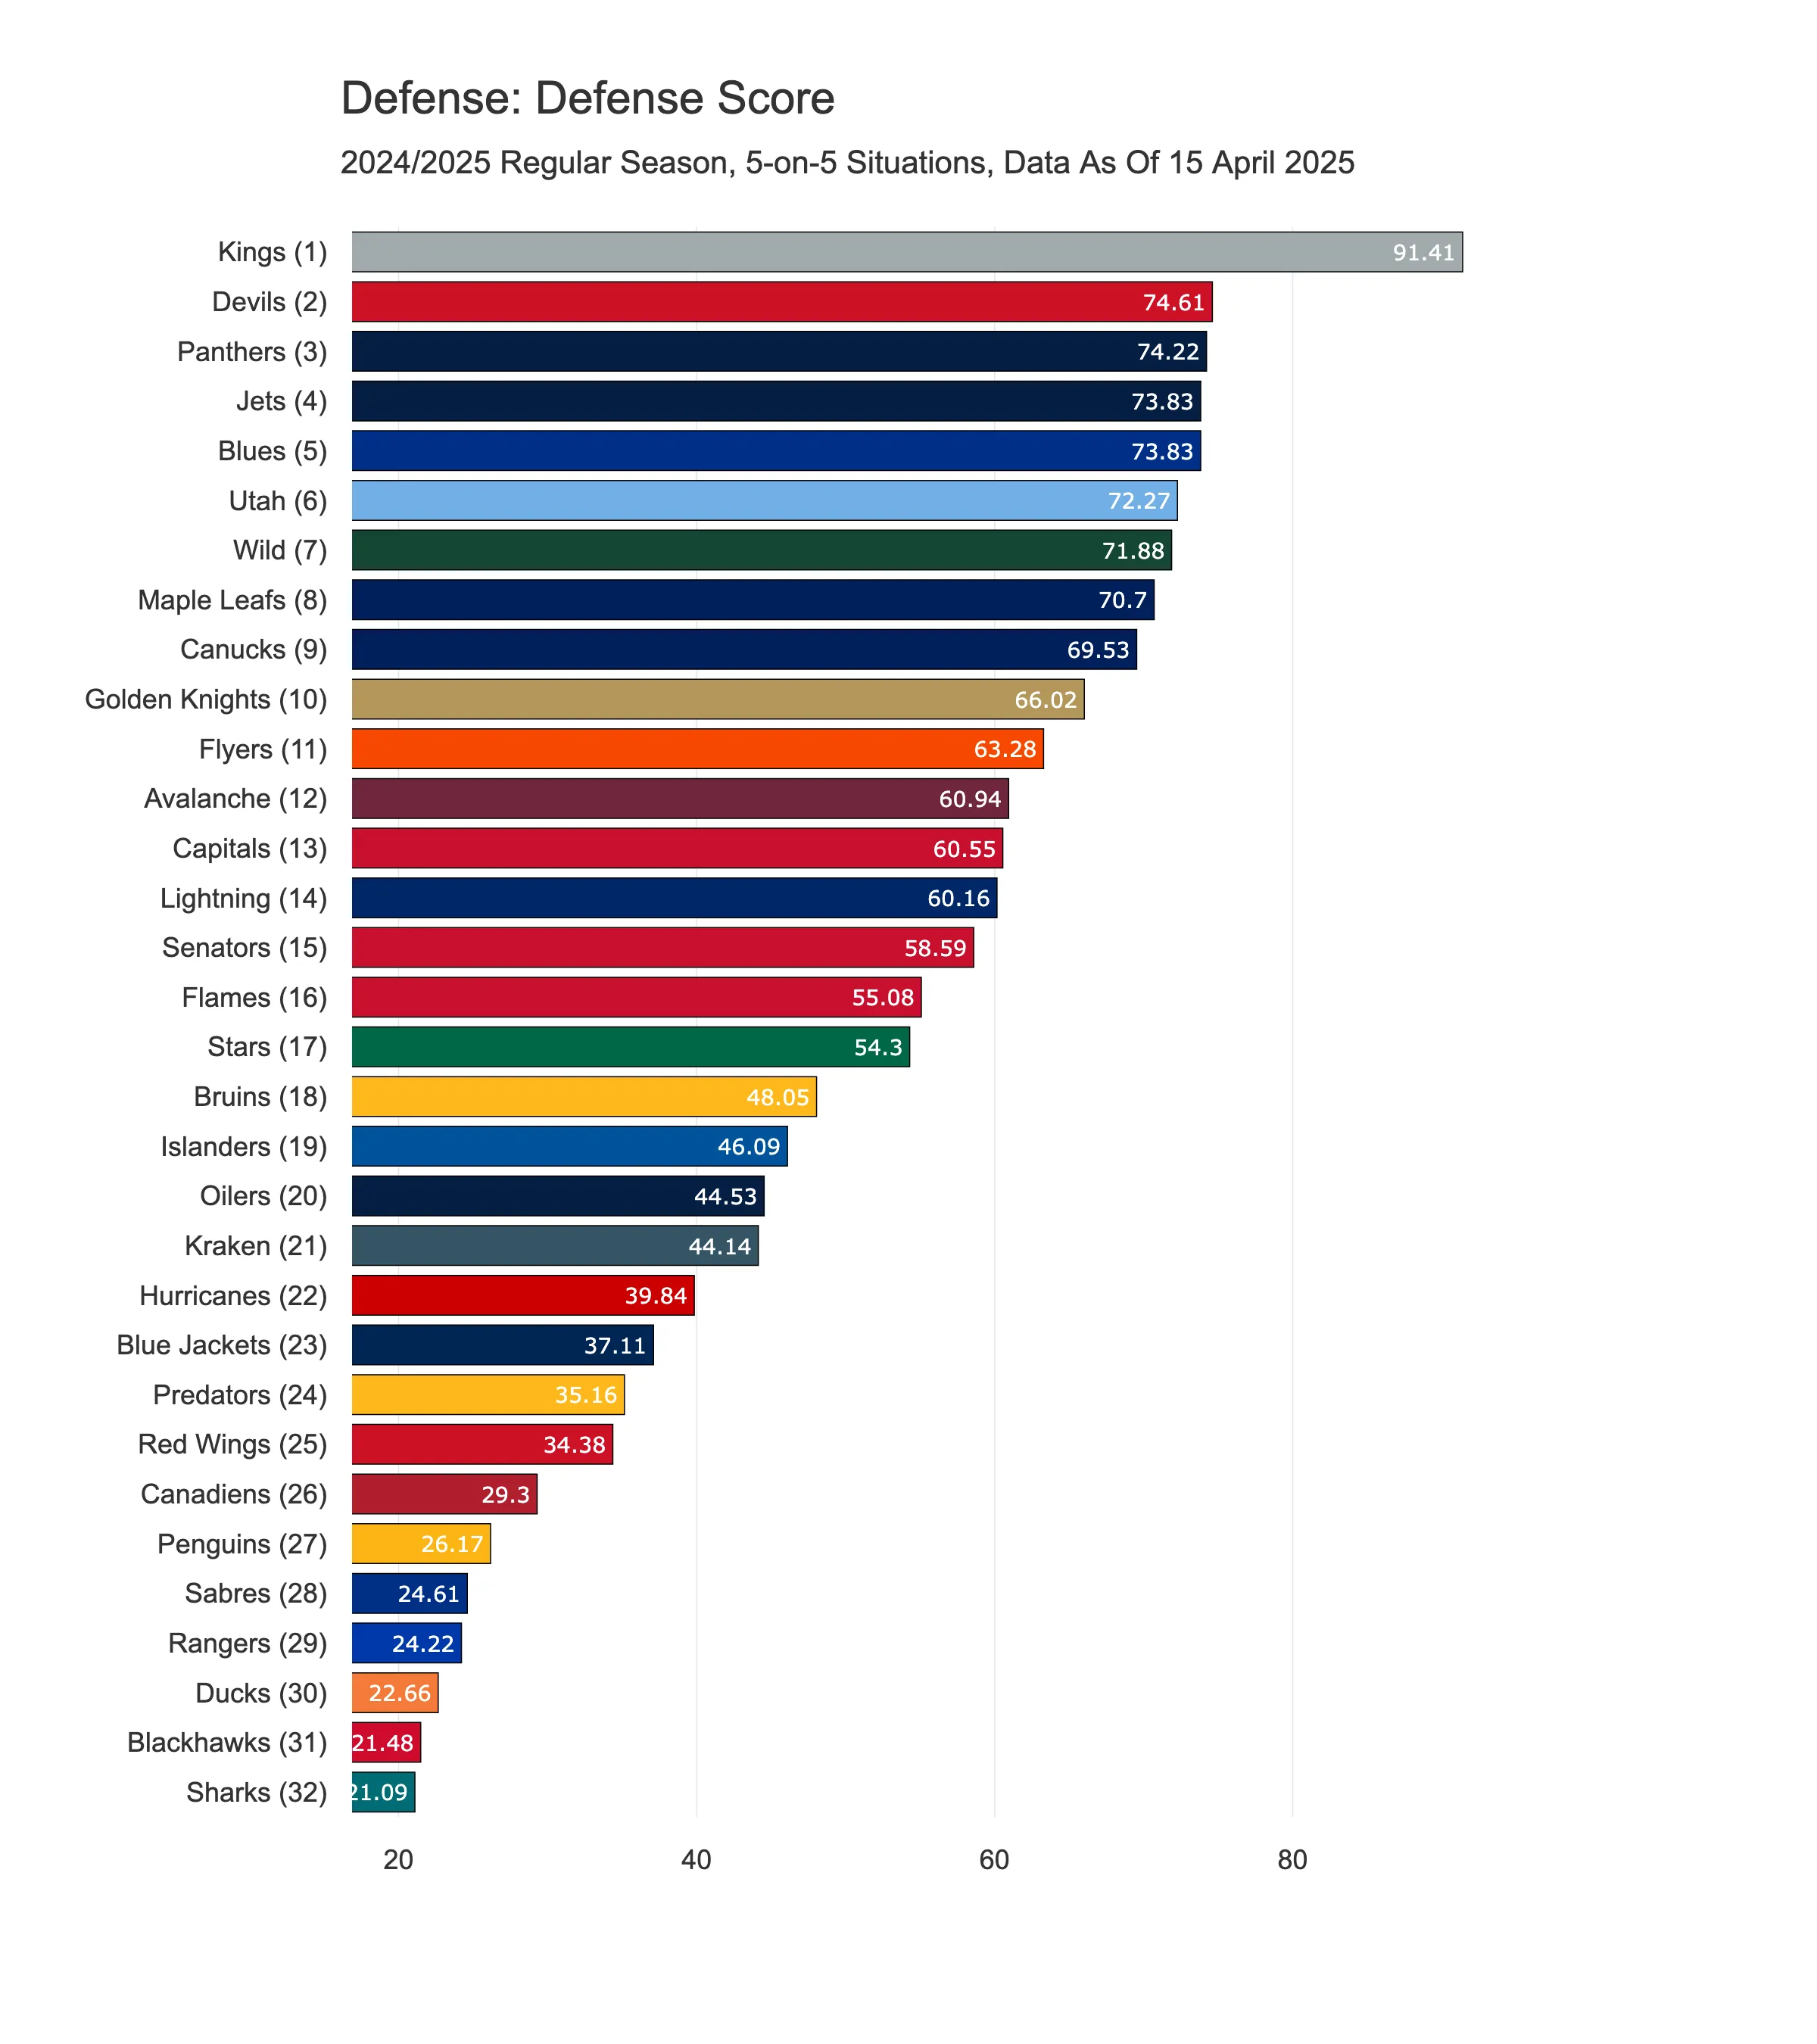
Defensive Rankings: The Best and Worst NHL Teams
Each team was ranked in these eight categories, assigned a percentile score for each, and then averaged to create a final Defense Score.
Key Takeaways
Elite Defense
Kings simply dominate the defense rankings, and it’s worth pointing out just how far ahead they are in this category. When we look at the individual metrics, there isn’t a single one where they rank in the bottom half of the league. They’re 2nd in goals against, 5th in shots against, 4th in blocked shots, 9th in low-danger shots allowed, 3rd in high-danger shots allowed, 1st in xGA/60, 3rd in xGA/100 shots, and 3rd on the penalty kill. And they’ve managed all that with a blue line including players like Joel Edmundson, Mikey Anderson, Vlad Gavrikov, Jordan Spence, and 22-year-old Brandt Clarke, who likely had a breakout season this year. I’ve deliberately not mentioned Drew Doughty—arguably their best defenceman—because he missed a fair bit of time with an ankle injury. That being said, it’s important to remember that many of these stats aren’t down to defencemen alone. Team defence is about more than just the blue line. It includes the forwards and goalies too. Credit where it’s due: the Kings have built one of the most well-rounded defensive units in the league, and my guess is they will be a tough team to beat in the playoffs.
The Hurricanes
A team that particularly caught my eye was the Hurricanes.
They dominated in terms of shot volume and penalty killing. They were pretty average when it came to goals against and xG/60. But they really struggled across all the shot quality metrics. What does that tell us? They don’t concede a high number of shots overall, but when they do, they tend to be from high-danger areas.
And I think the reason behind this is their style of play. The Hurricanes defensemen are very active. They step up at the blue line to keep the puck in the zone, leading to more offensive zone time but increasing the chance of getting beat clean if the puck gets by. This contributes to the shot quality issue: fewer shots, but more dangerous ones when mistakes happen.
Struggling Teams
California really has it all. The Kings have the best defensive score in the league, while the Sharks and Ducks sit at the very bottom.
We already touched on the Sharks in the previous article—they’re in the midst of a rebuild, so it’s no surprise they’re struggling, and we can expect that to continue for a while. But the Ducks? With such a promising mix of experienced players and young talent, the “rebuild” excuse doesn’t seem to hold up anymore. Personally, I expected much more from them this season.
Another team that’s been underwhelming—and one many of us expected more from—is the Rangers, especially after they won the Presidents’ Trophy last year. To me, the Ducks and Rangers are quite similar: both teams give up a lot of shots. The Rangers, in particular, allow a high number of dangerous chances, while the Ducks have really struggled on the penalty kill. That said, both teams are only slightly below average in terms of goals against—which speaks volumes. It likely confirms what many of us have quietly suspected: even though they haven’t been solid defensively, they’ve been saved by their goaltenders.
Final Thoughts: Defense as a Foundation of Success
A strong defense is often a hallmark of playoff-ready teams. While it won’t win games on its own, it provides the stability that can carry a team through tight postseason matchups.
In the next article, we’ll shift focus to goaltending, breaking down which netminders have truly made a difference this season!