· Jaroslav Bezdek · Analysis · 11 min read
The NHL Team Rankings: Goaltending
Which teams had the best goaltending during the 2024/2025 regular season? And which teams weren't able to find the optimal tandem of netminders? Let's find out!
Goaltending can make or break a season. While defense plays a role in limiting chances, a great goalie can steal wins—and a struggling one can sink even the best defensive units. In this fourth part of the analysis series, we shift our focus to the blue paint, breaking down the Goaltending Score for the 2024/2025 NHL season.
Goaltending Related Statistics
Many hockey analysts would agree that evaluating goaltenders is, to put it mildly, a tricky business. The stats traditionally used to assess goalies are often criticised for being flawed and failing to tell the full story. But is that really the case? Let’s take a look.
- Goals Against Average (GAA) – This measures the average number of goals a goalie concedes per 60 minutes of play. However, it doesn’t account for game situations. A goal conceded while on the penalty kill is counted the same as one allowed at even strength. But we all know that’s hardly a fair comparison, right?
- Save Percentage (SV%) – This shows the percentage of shots on target that the goalie stops. It’s a decent stat, but it doesn’t factor in shot quality and can be quite volatile in the short term, especially when the sample size is small. For instance, a goalie who faces 10 low-danger shots from the blue line and lets in one goal will end up with the same SV% as someone who faced 30 high-danger chances from the slot and let in three. That clearly doesn’t seem right.
- Shutouts – This simply counts the number of games in which a goalie concedes no goals. While shutouts are impressive, they’re often more reflective of team performance than individual brilliance. If a team defends superbly and blocks most of the opposition’s shots, the goalie might not have to do much but still ends up with a clean sheet.
Because these traditional stats don’t quite cut it, I’ve opted for a different set of metrics, which together form the Goaltending Score.
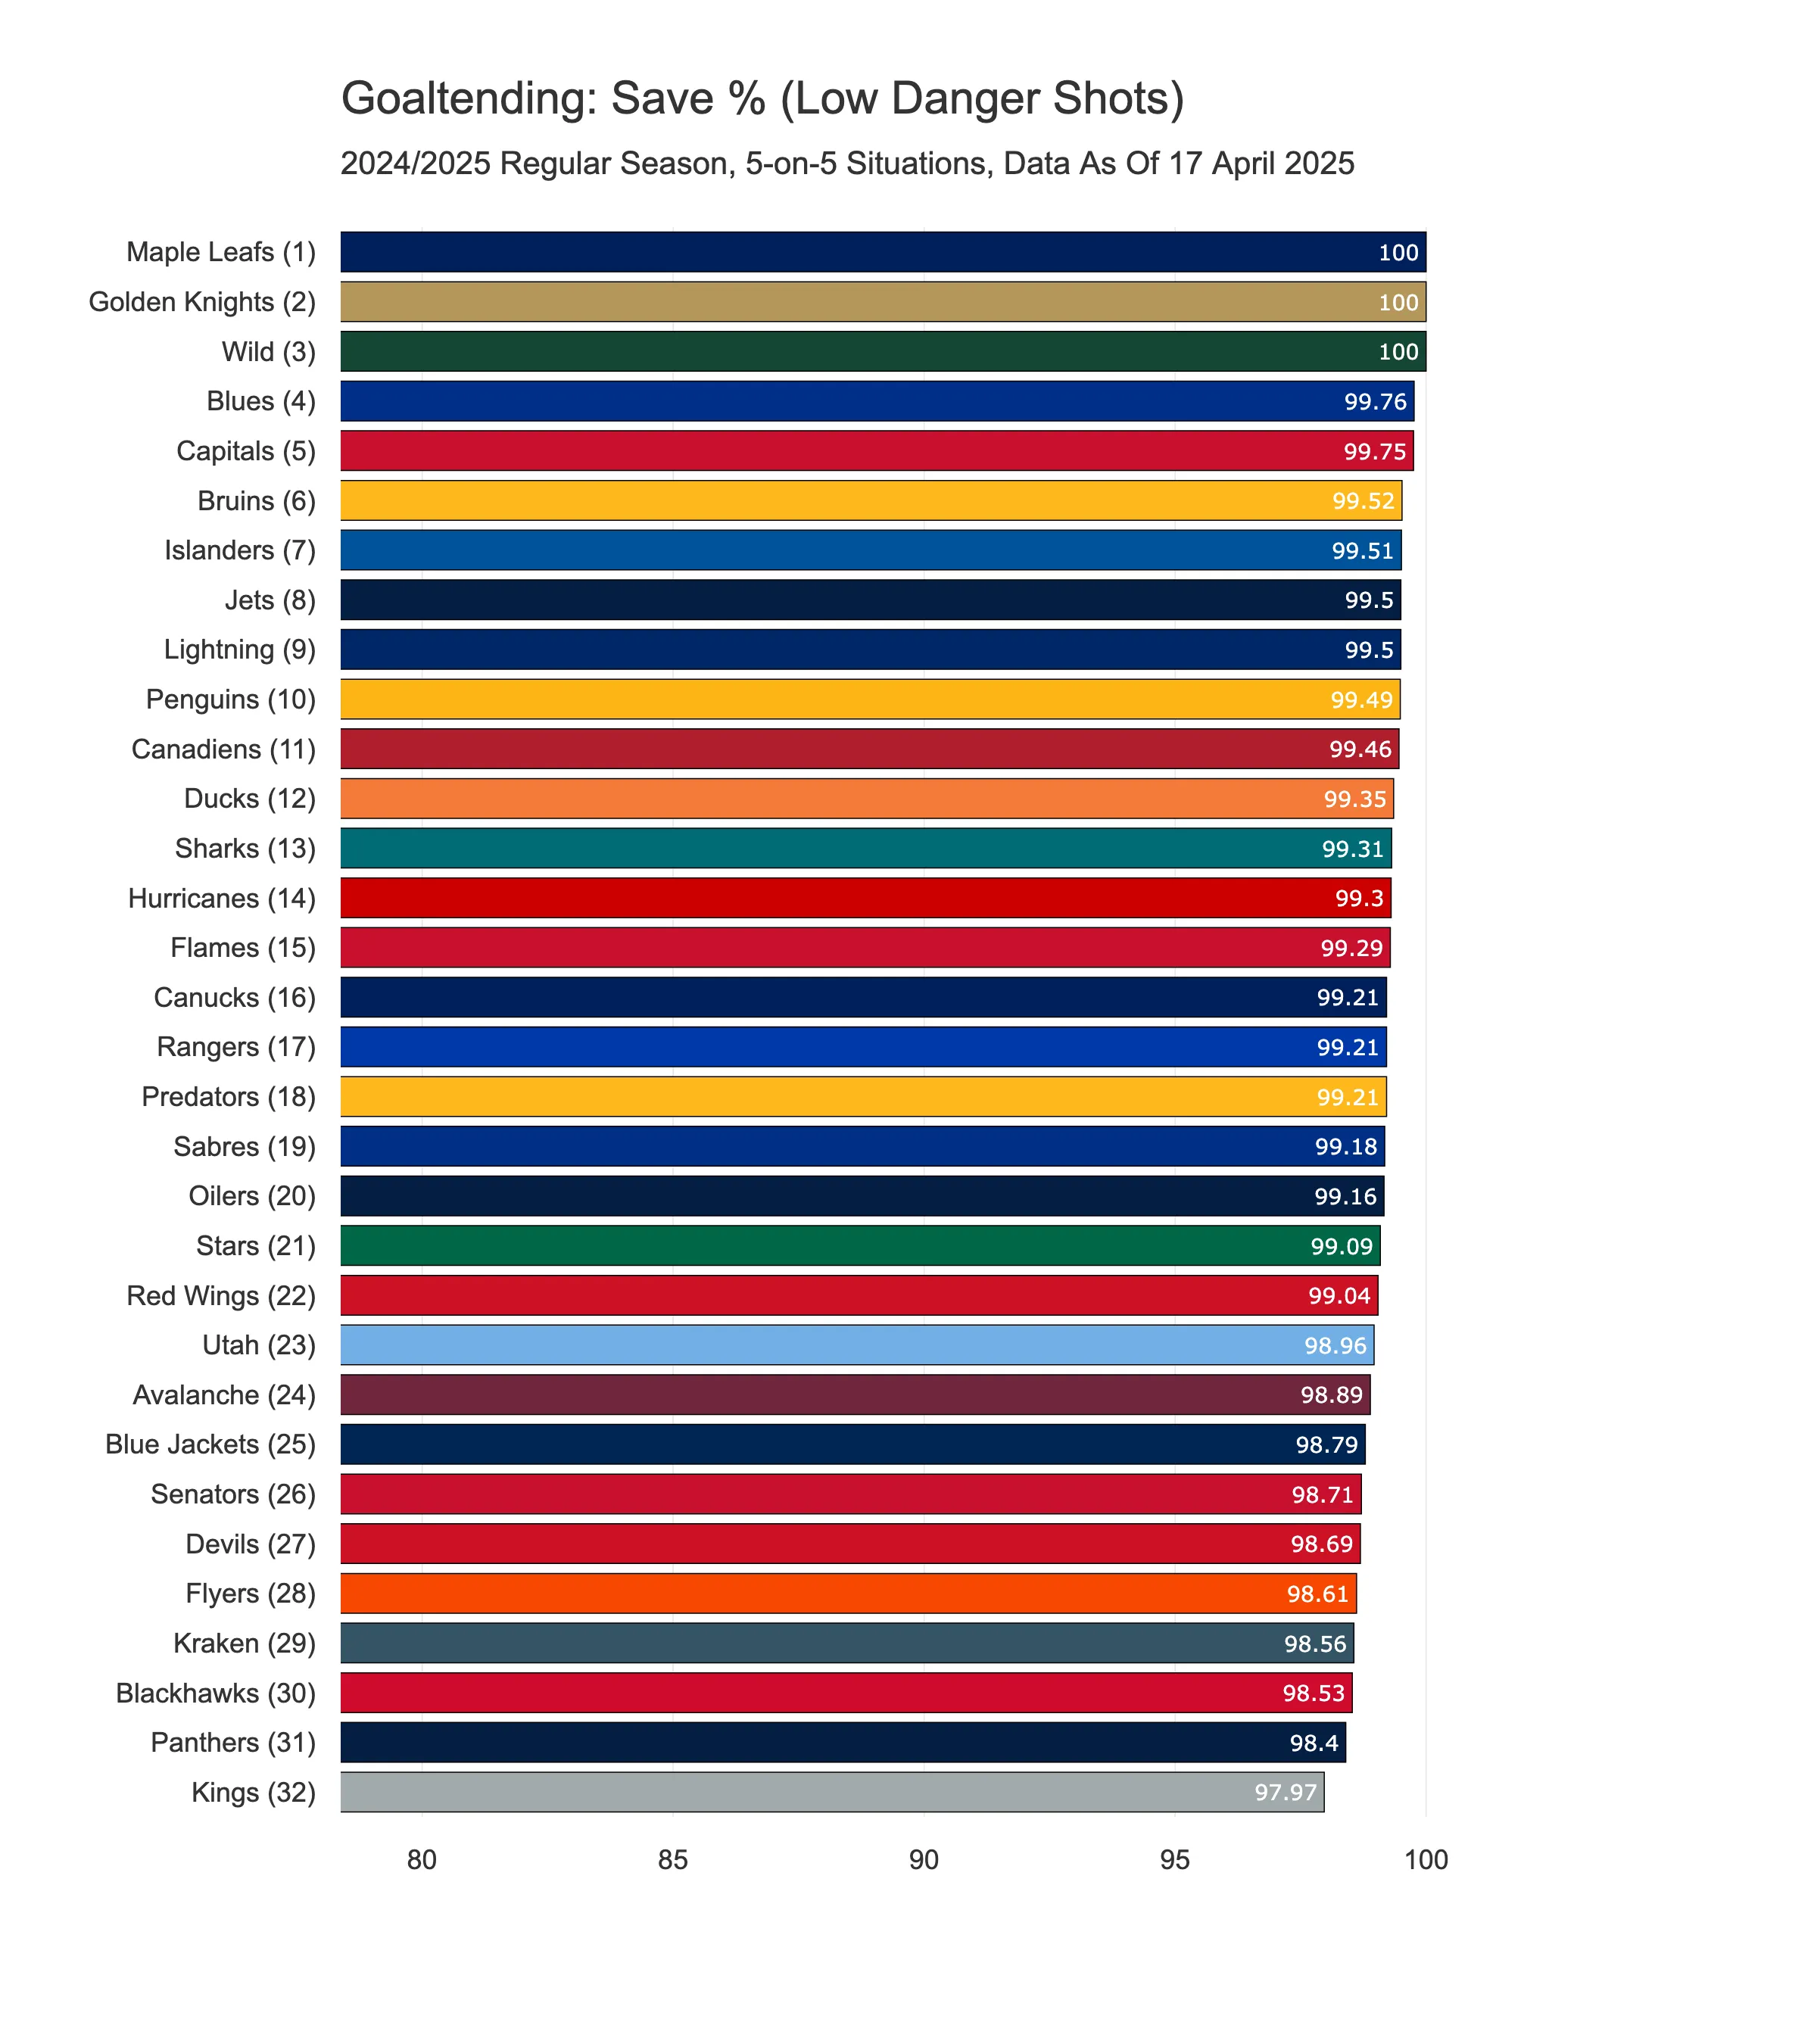
1) Save % (Low Danger Shots)
We previously mentioned that Save % has two main drawbacks: it doesn’t account for shot quality, and it can be quite volatile in the short term. So, I set out to address both of these issues.
To tackle the first one—shot quality—I focused solely on 5-on-5 situations and calculated Save % separately for low, mid, and high-danger shots. This gives a much clearer picture of a goaltender’s performance based on the quality of chances faced.
As for the second issue—short-term volatility due to small sample sizes—I used data from the entire season. That gave us around 400 low-danger shots, 800 mid-danger shots, and 400 high-danger shots per team in average. From my point of view, that’s more than enough to get a solid read on how the goalies have performed.
And the results are quite telling. The Save % for low-danger shots shows very little variation between teams, which suggests goalies are generally consistent when facing easier chances. In fact, there are three teams—the Maple Leafs, the Golden Knights, and the Wild—whose goalies managed to stop 100% of the low-danger shots they faced!
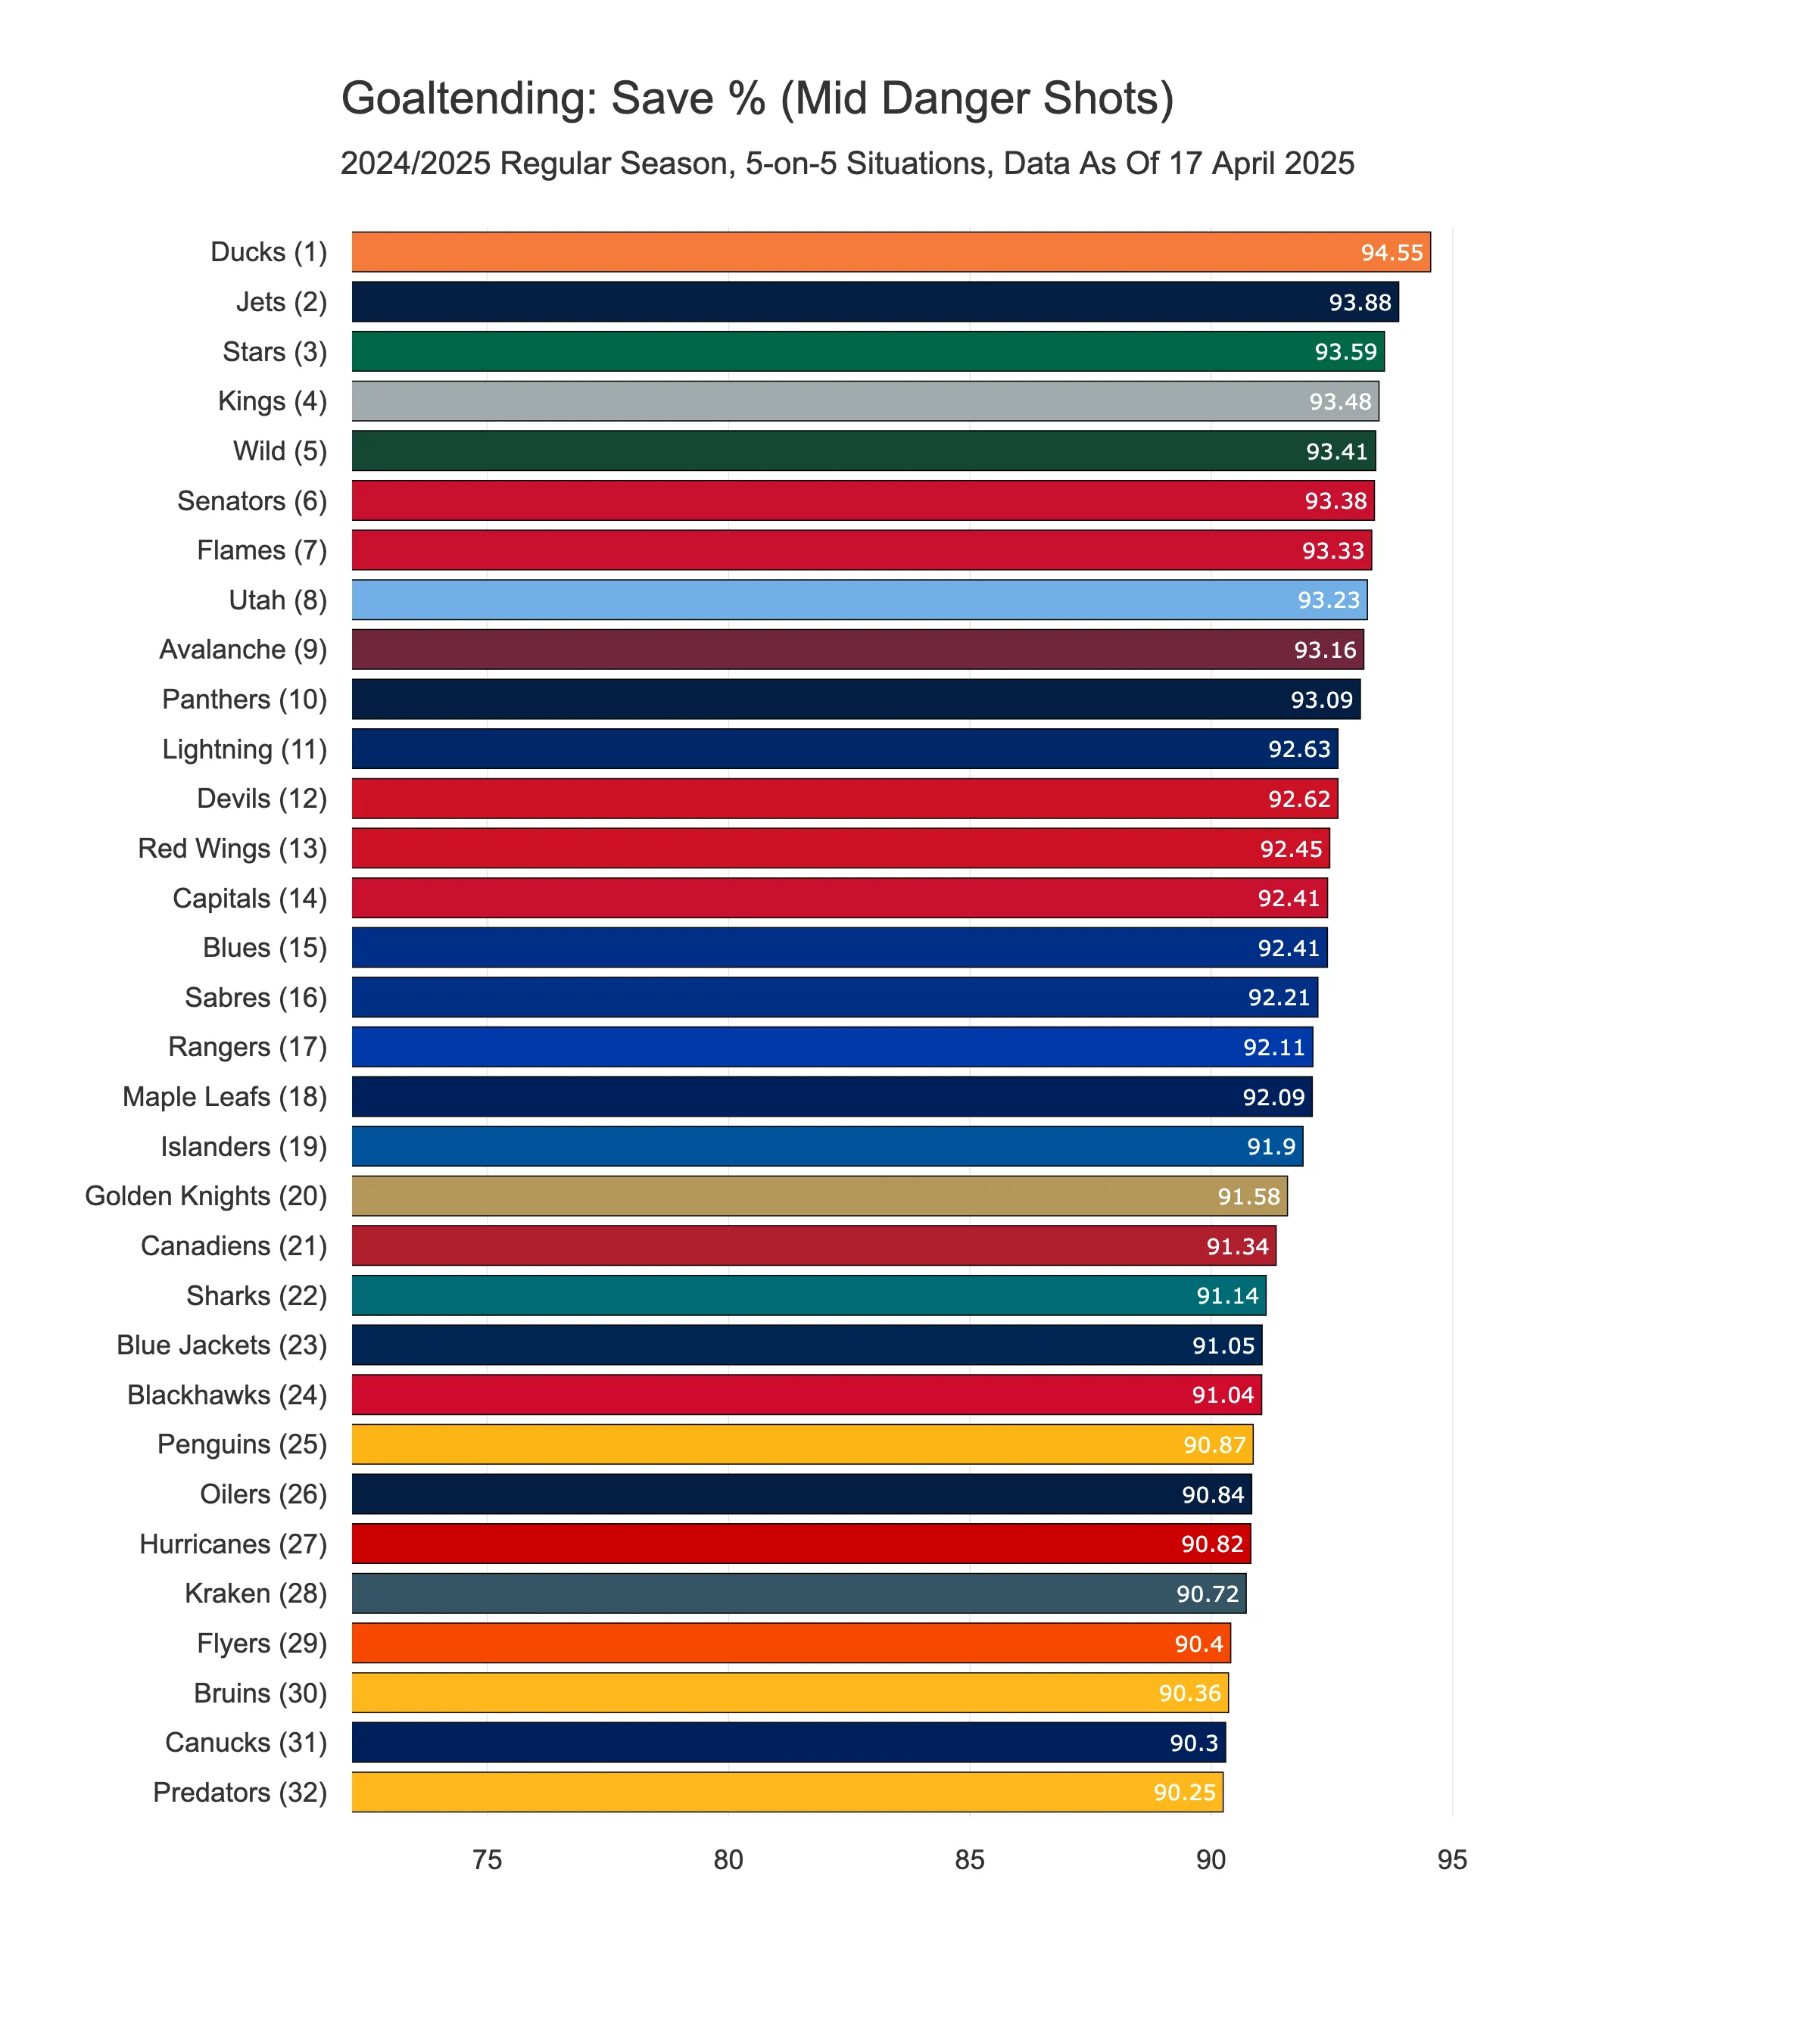
2) Save % (Mid Danger Shots)
The second chart shows the Save % for mid-danger shots. Here, we can see that the range is a bit wider, which means goalies are less consistent when facing these types of chances. You’ll also notice the whole distribution has shifted—the highest value is 94.55%, which is actually lower than the lowest Save % for low-danger shots (97.97%). That proves our point that shot quality really matters!
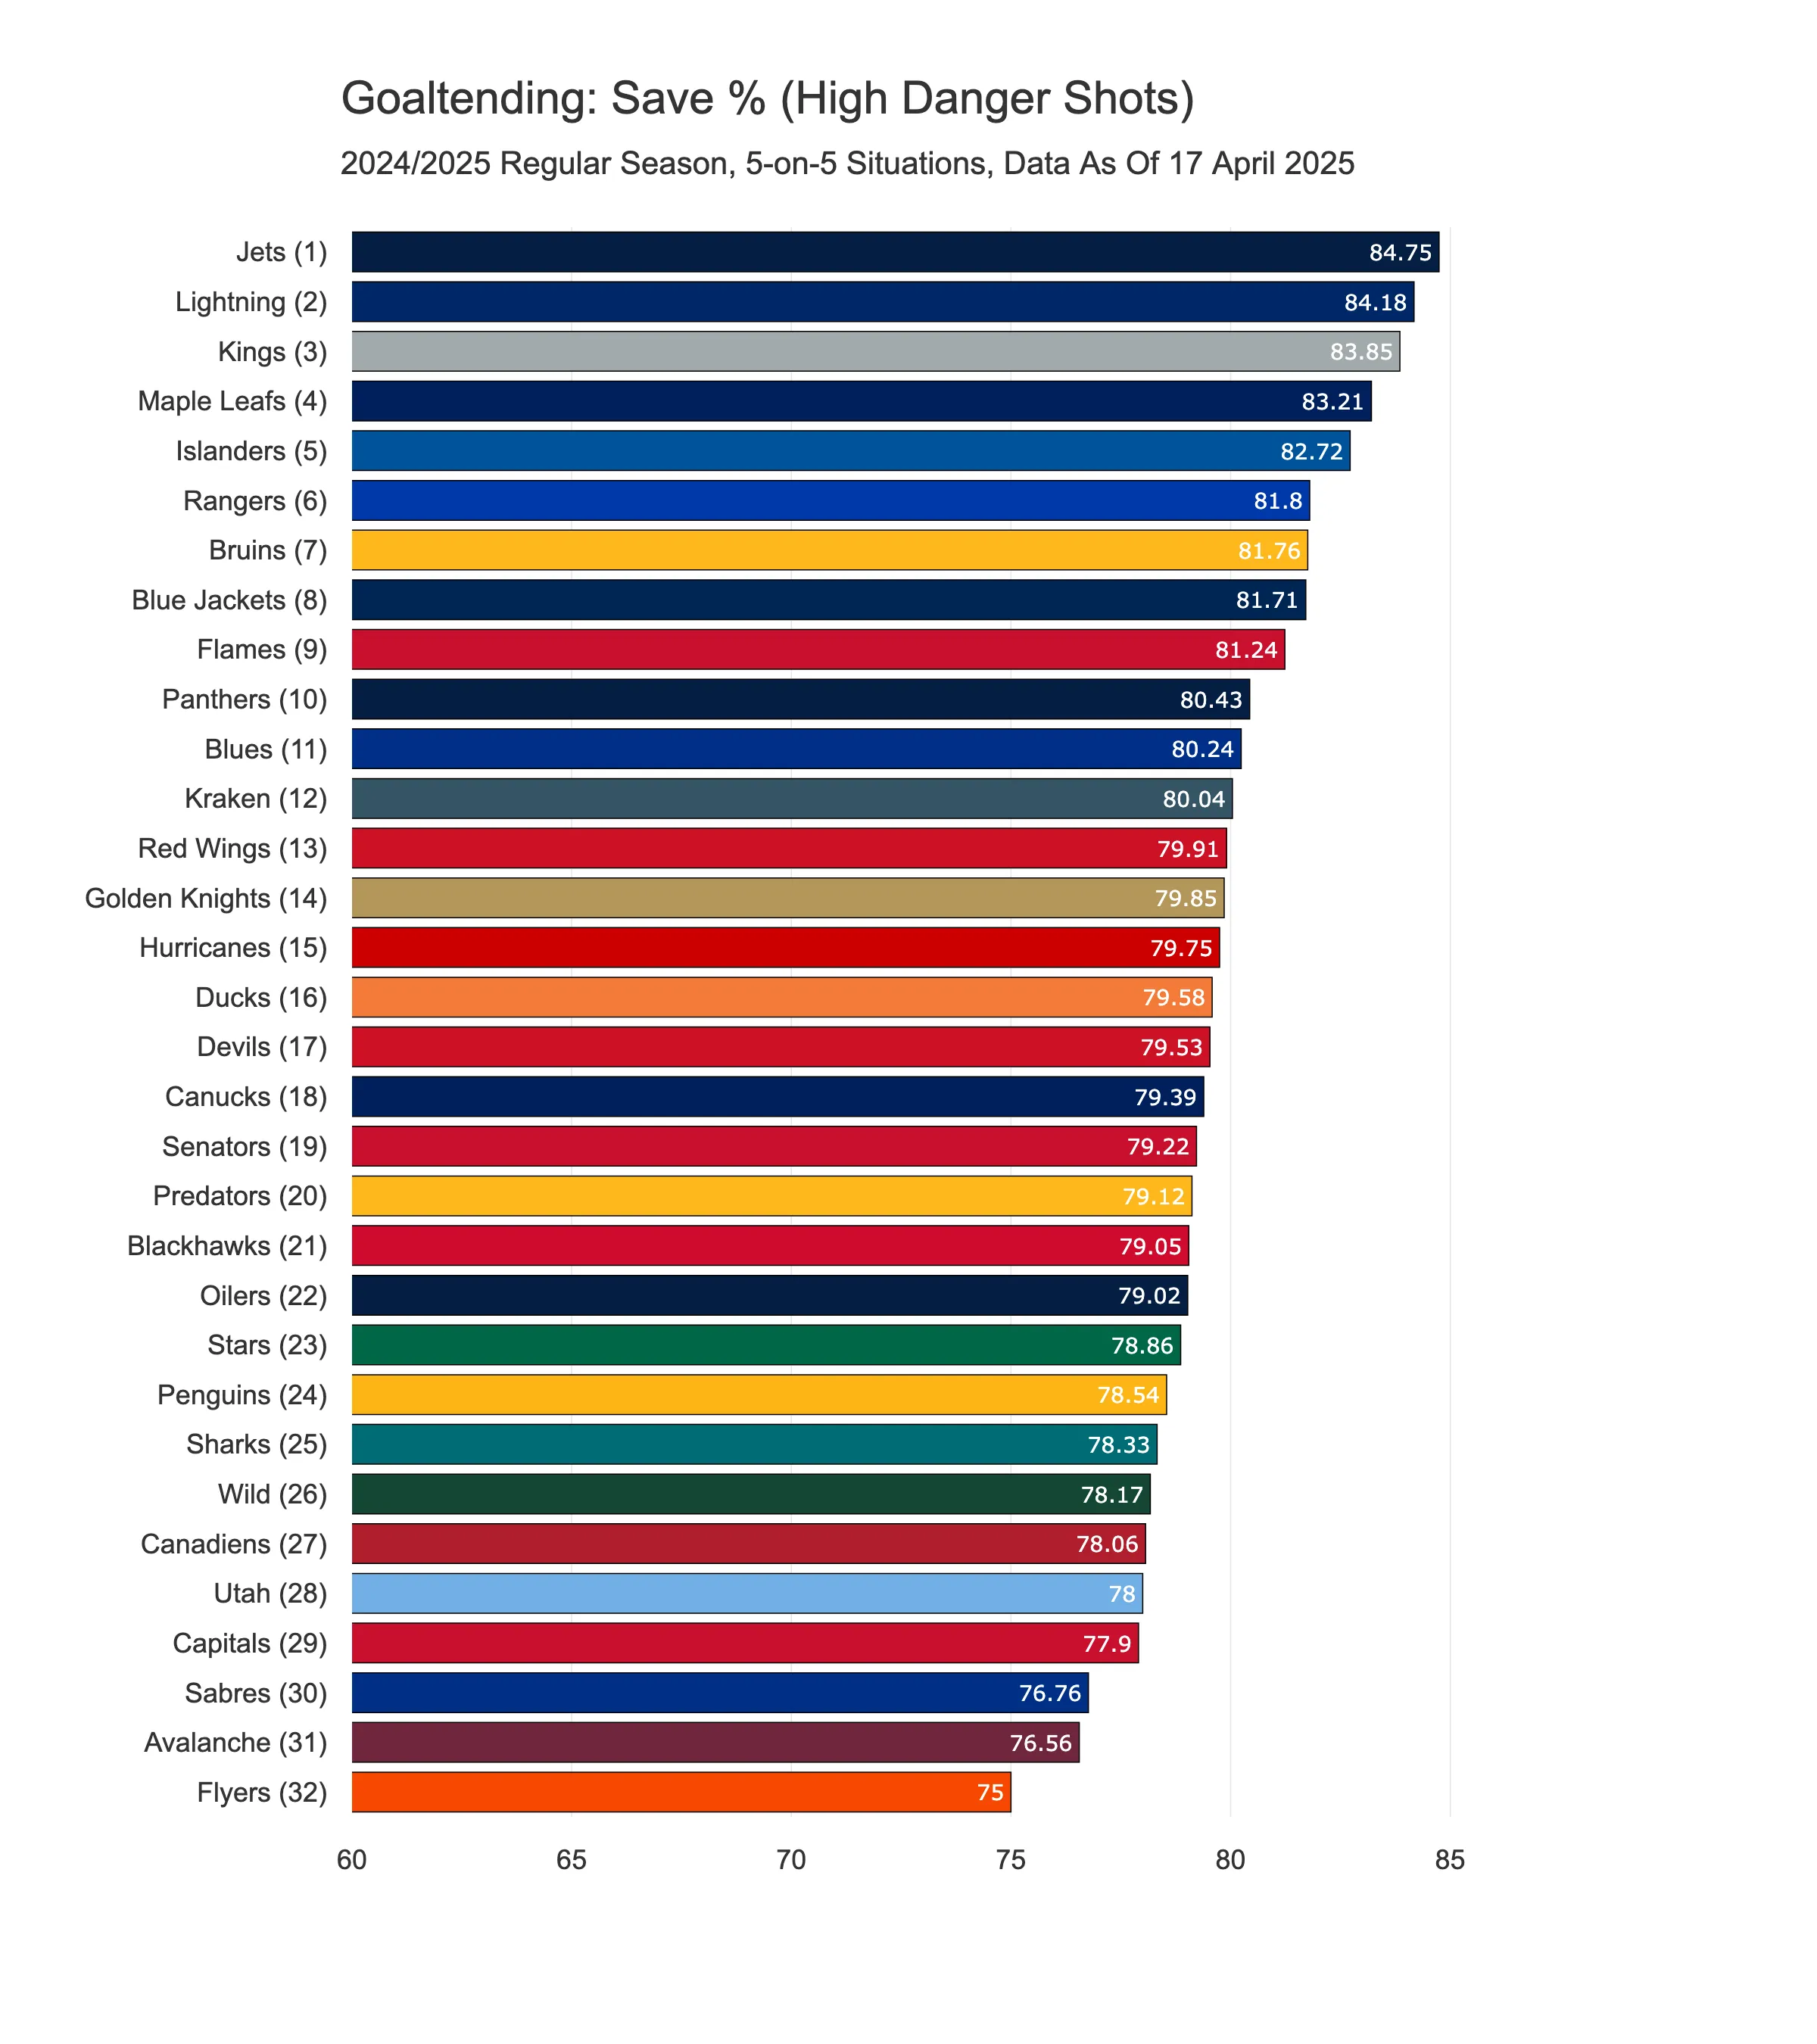
3) Save % (High Danger Shots)
The range of Save % for low-danger shots is around 2 percentage points (from 97.99% to 100%), for mid-danger shots it’s about 4 points, and for high-danger shots it jumps to roughly 10! This tells us that teams are far less consistent when dealing with high-danger chances—and those are the ones that really affect a goalie’s overall save percentage. In contrast, how well a goalie handles low-danger shots doesn’t have as big an impact on the overall numbers.
Looking at the chart below, the best goaltending tandems at stopping high-danger chances belong to the Jets, the Lightning, and the Kings. Based on the share of games played this season, we’re mainly talking about Connor Hellebuyck, Andrei Vasilevskiy, and Darcy Kuemper.
At the other end of the spectrum are the teams who’ve struggled the most with high-danger shots. The worst tandems in this category are the Flyers, the Avalanche, and the Sabres.
4) Saved Goals Above Expected/60 (GSAx/60)
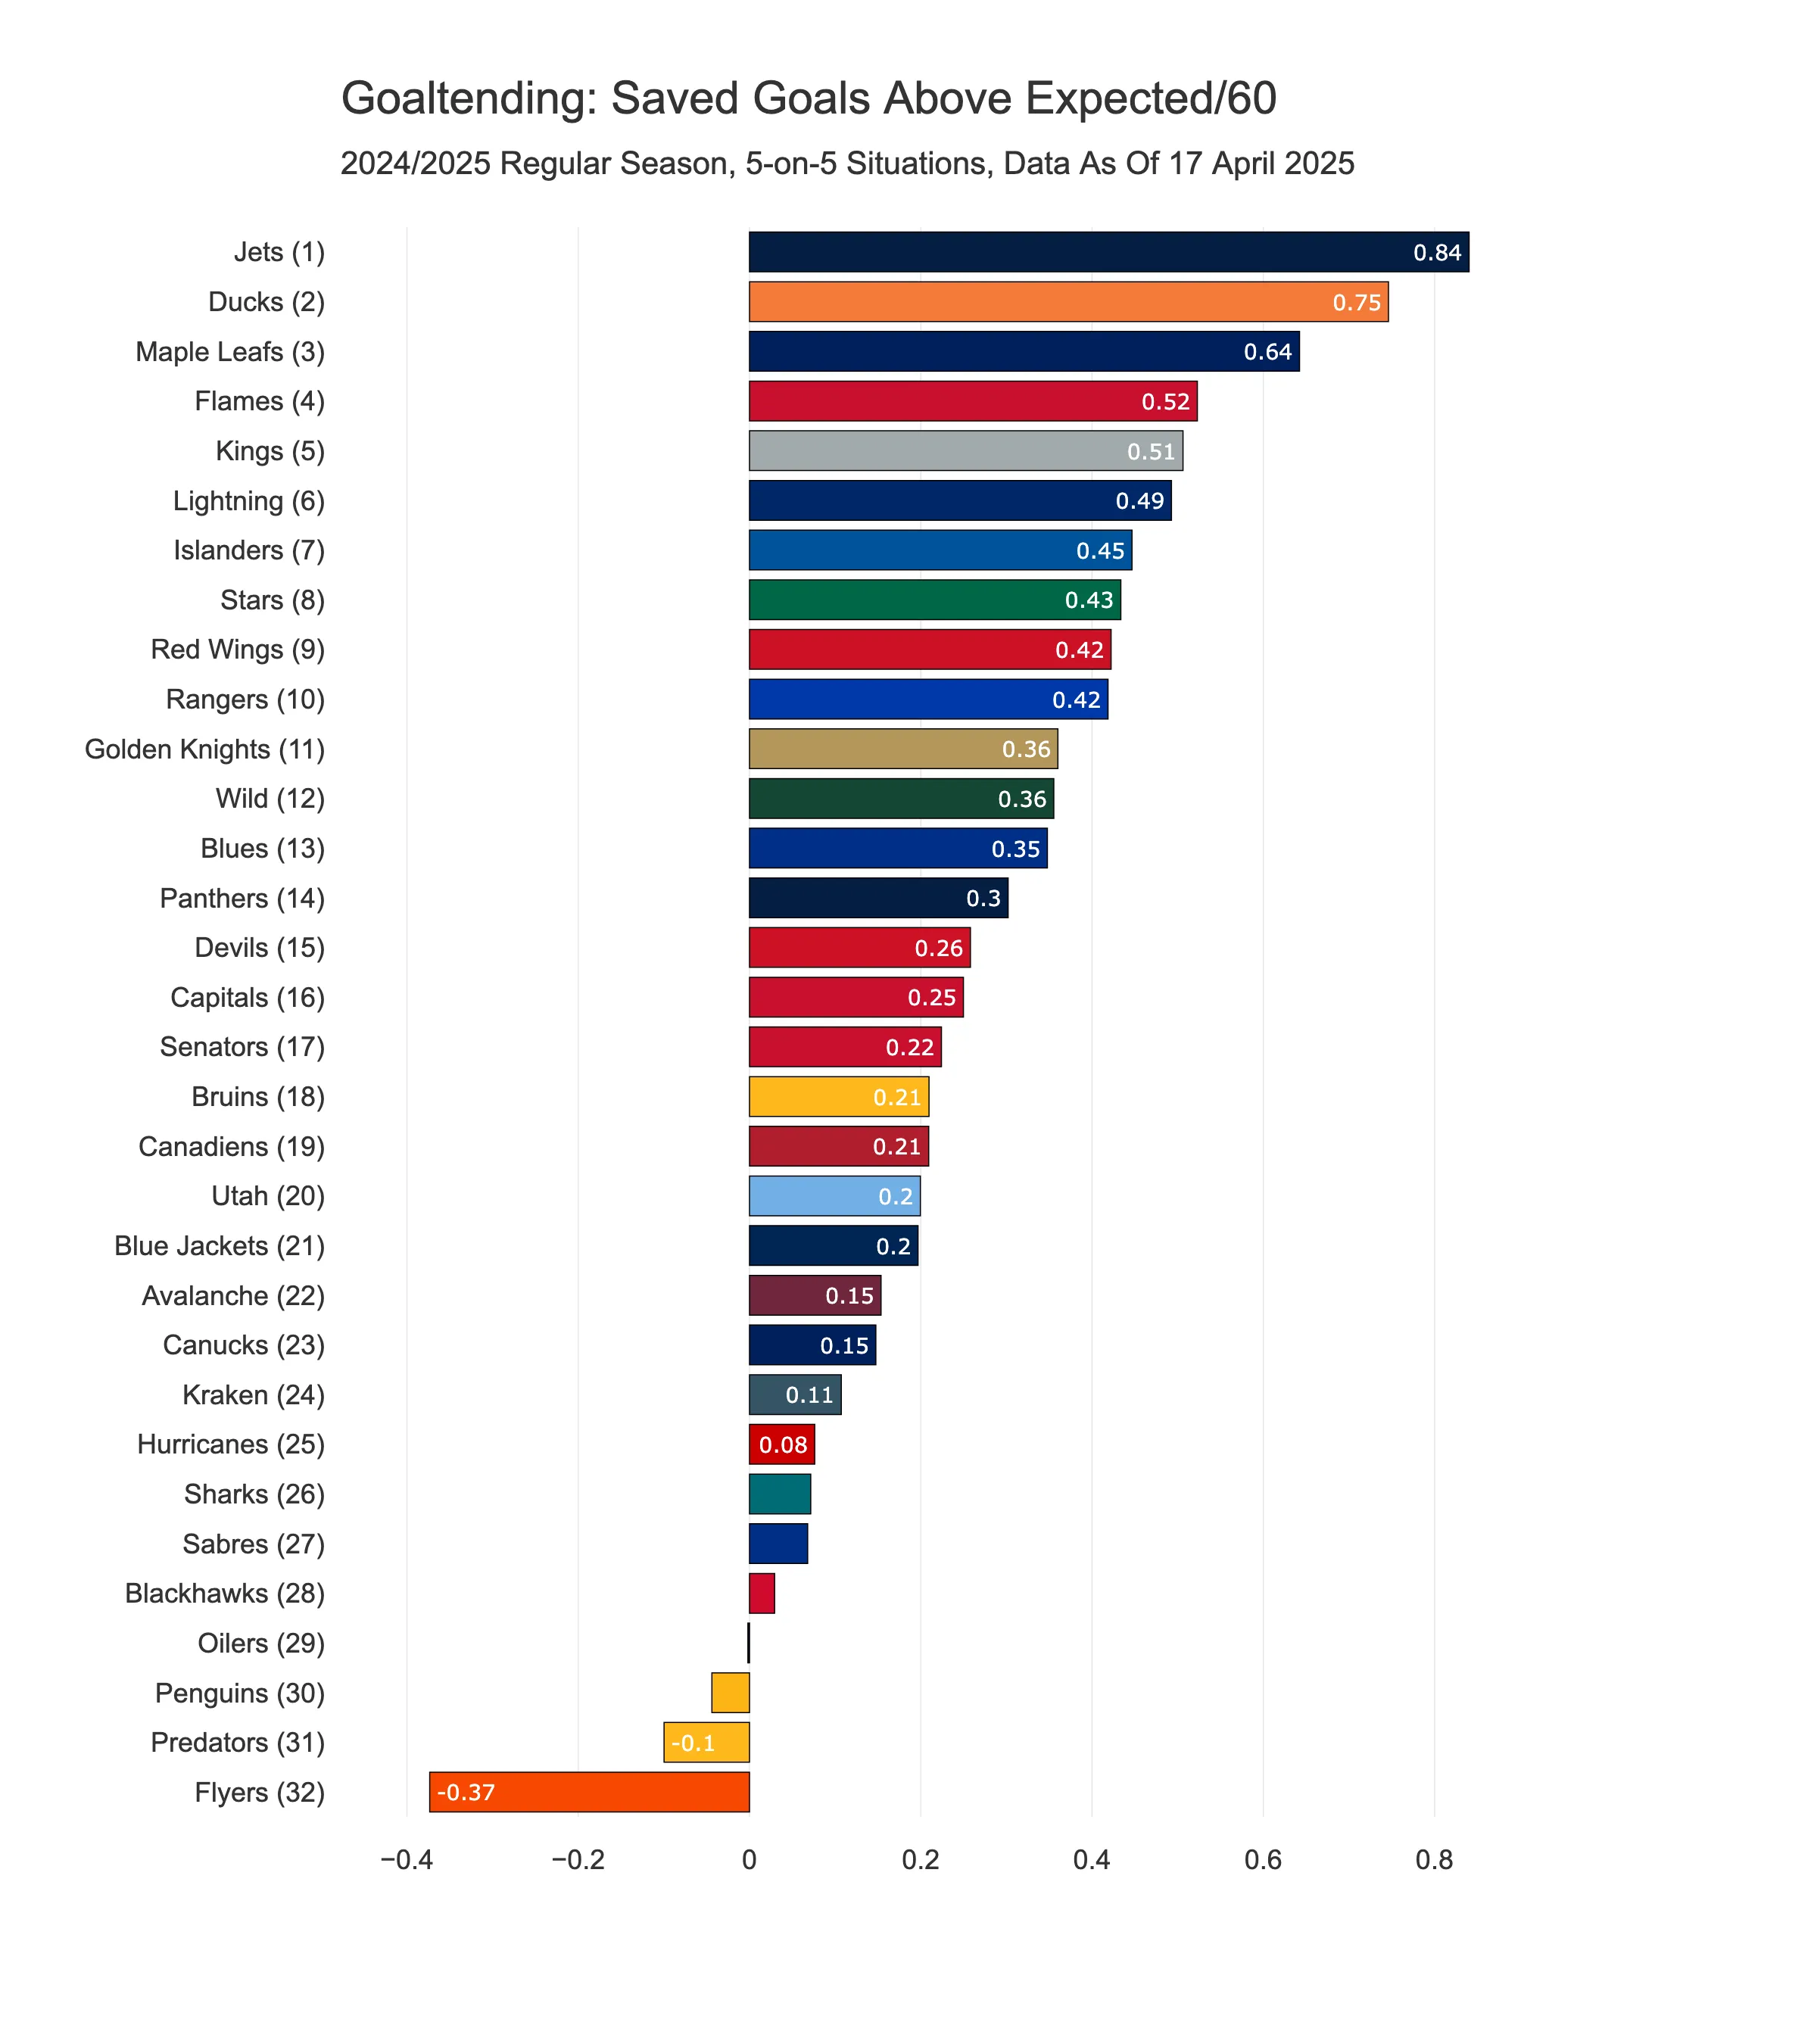
This stat shows the difference between how many goals a goalie was expected to concede based on the quality and quantity of shots they faced, and how many they actually let in. A positive GSAx (Goals Saved Above Expected) means the goalie saved more than expected, while a negative number means they let in more than they should have—measured on a per-60-minute basis.
The Jets’ goalies absolutely dominated this category, saving 0.84 more goals than expected per 60 minutes! That’s a massive contribution to the success of the team that went on to win the Presidents’ Trophy this season.
The second team on the list is the Ducks. If you remember the defensive standings from my previous article, they were statistically one of the worst teams in the league this year. They allowed the most shots on goal and had the highest Expected Goals Against per 60 minutes. On top of that, they gave up a large number of high-danger chances! I remember seeing a lot of criticism on social media aimed at both their defence and their goalies—but looking at the numbers, only one of those complaints seems to be actually fair.
5) Stolen Games
Many hockey analysts say that goalkeepers are very unpredictable. Many studies show that goalies are the most inconsistent players in the NHL. A player that wins Vezina Trophy one season can be an absolute disaster the next one. That means that one of the very important atributes we would like to see in our analysis is the consistency of the goalies. And for that purpose I have added two following statistics that aim to be a good proxy for that.
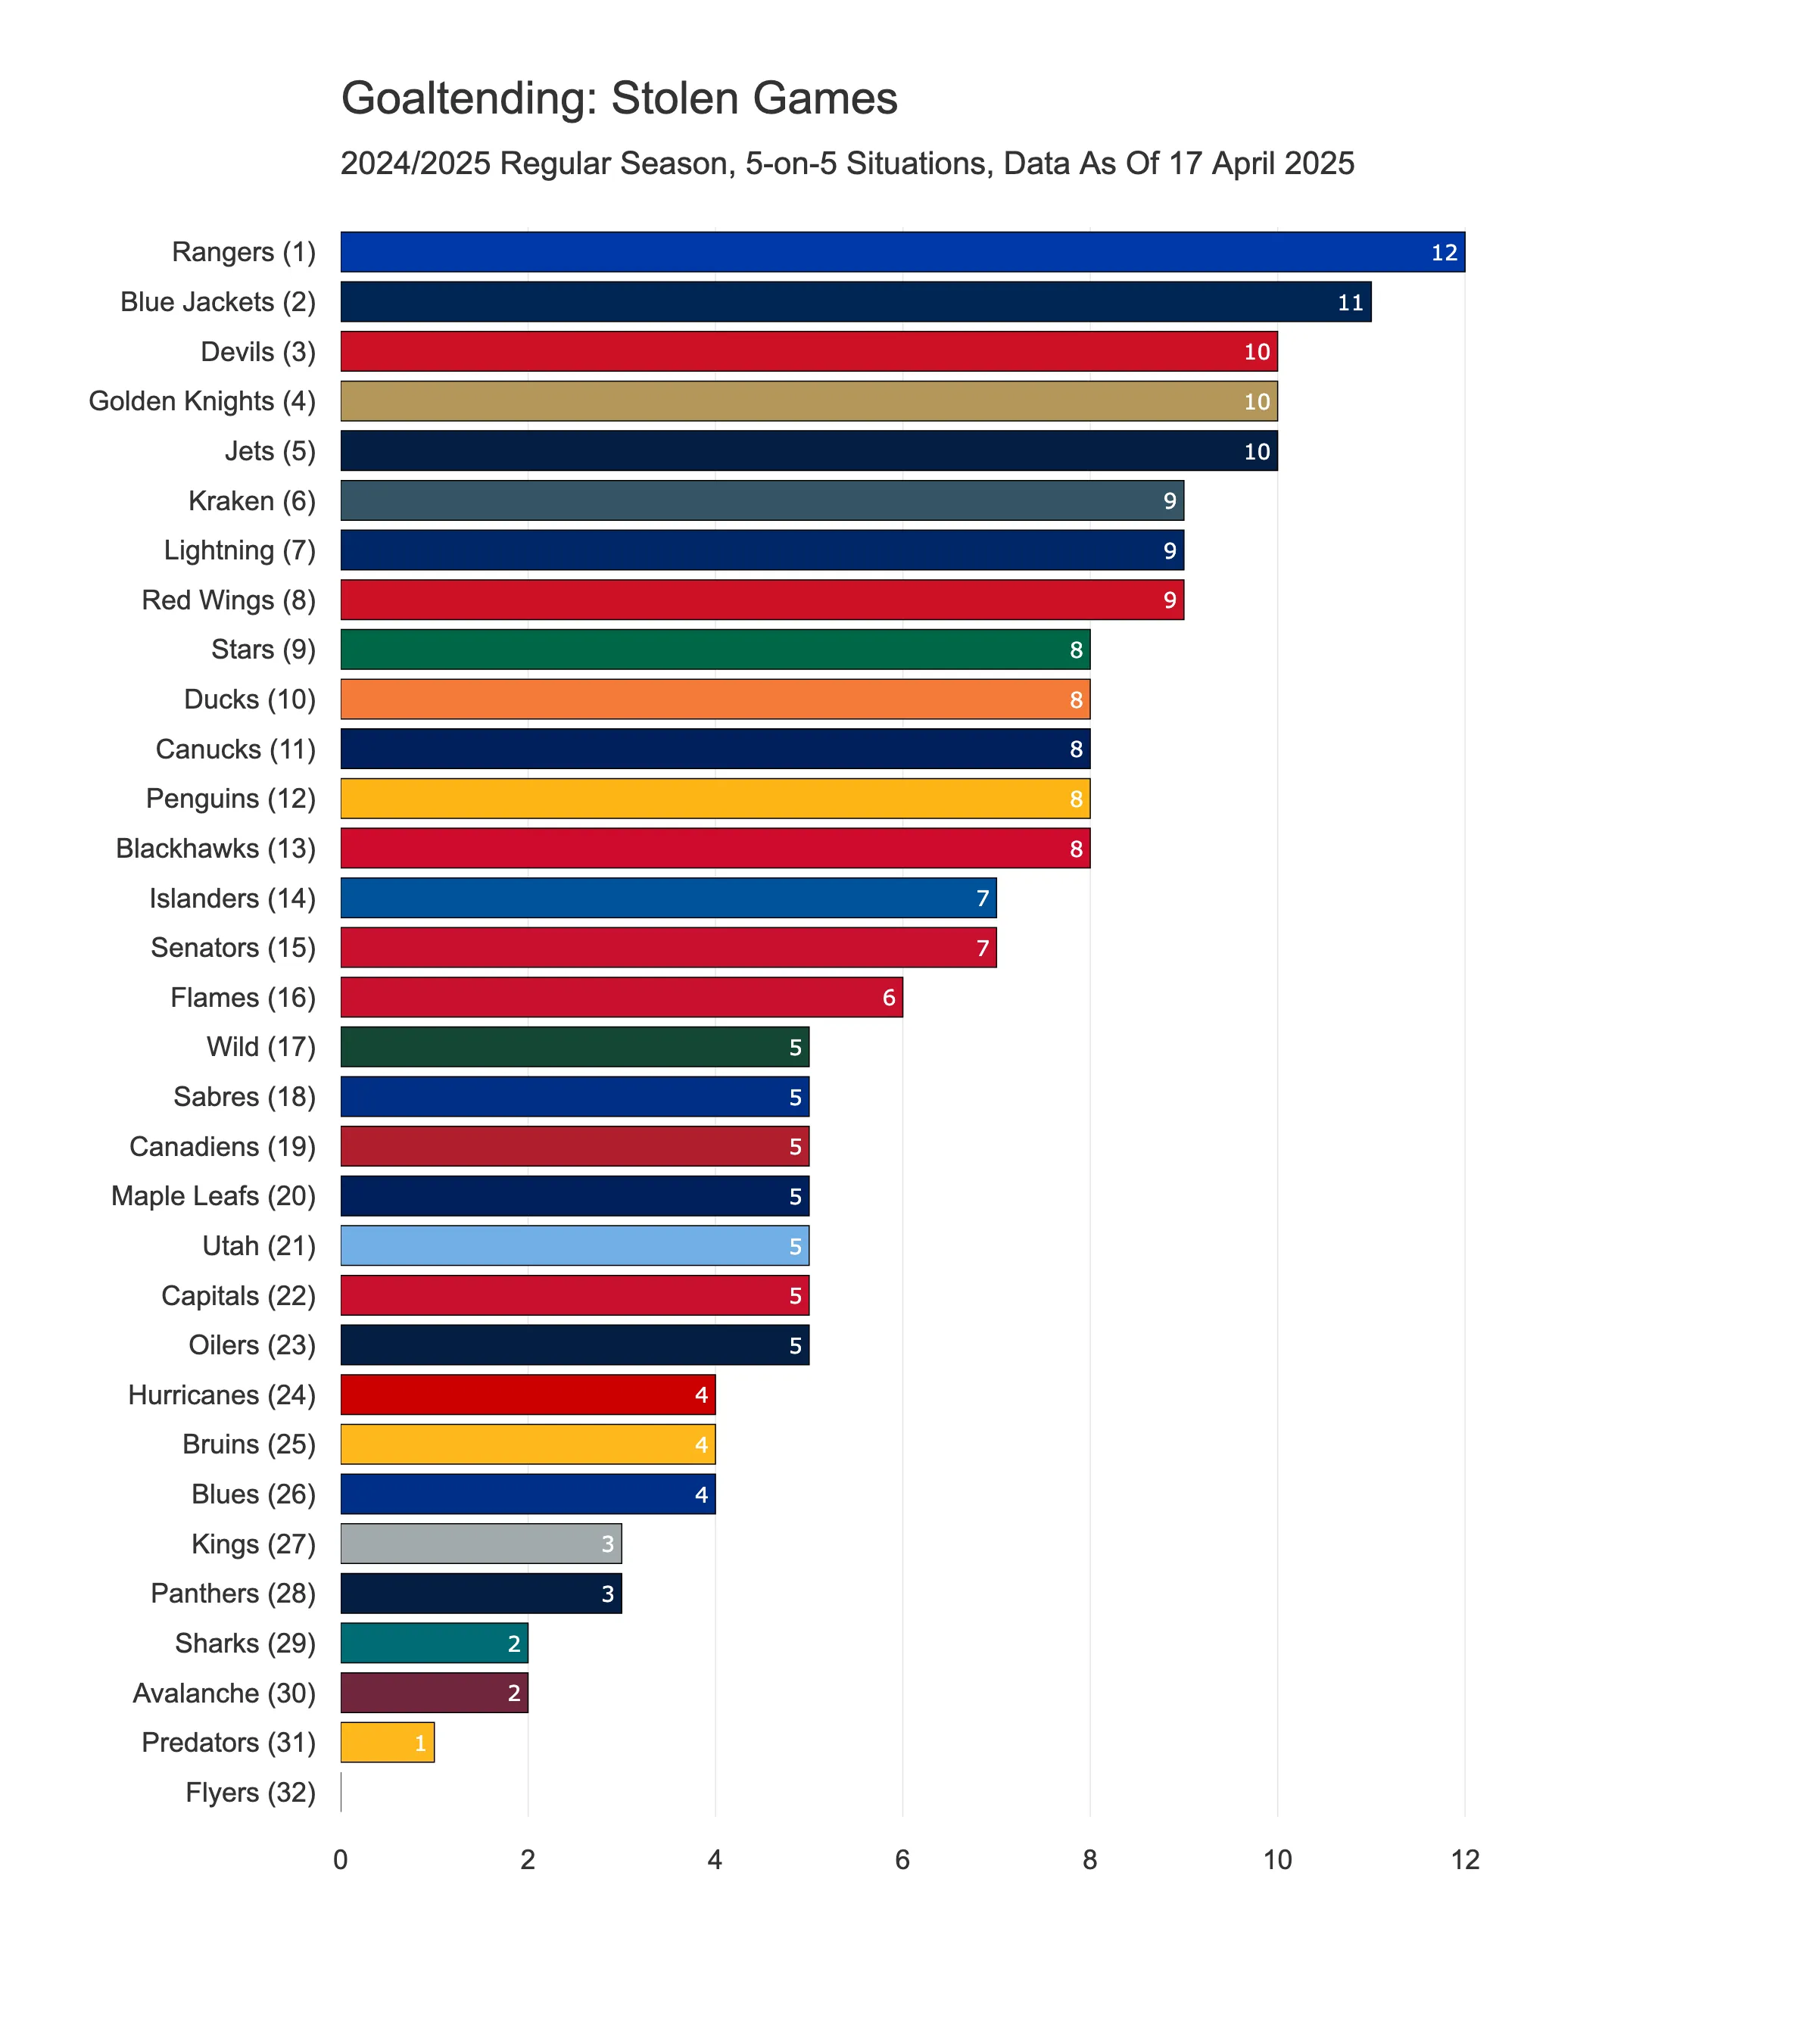
The first statistic is called Stolen Games. A stolen game in hockey refers to a situation where a goaltender plays exceptionally well, leading their team to victory despite facing overwhelming odds. This typically happens when the goalie faces a high volume of shots or high-quality scoring chances but still manages to keep the opposing team from scoring enough to win.
Even though the definition of a stolen game is not very clear, I have created a simple rule for it. In my application, a stolen game is credited to a goalie if they meet one of the following criteria.
- Based on Goals Saved Above Expected (GSAx): If a goalie saves more goals than expected, with a GSAx greater than 2 and allows 1 goal or fewer, this is considered a stolen game.
- Based on Save Percentage and Shots Faced: If a goalie has a save percentage greater than 95% and faces 30 or more shots, it is also classified as a stolen game, as this demonstrates an exceptional performance under high-pressure conditions.
These criteria identify games where a goalie’s extraordinary performance directly contributes to securing a victory, even when the team may have been outshot or faced difficult scoring chances.
From the chart below, you’ll see that the most stolen games came from Rangers goalies (12), followed by the Blue Jackets (11), the Devils, Golden Knights, and Jets—each with 10. At the other end of the scale, the only team without a single stolen game was the Flyers.
6) Poor Games
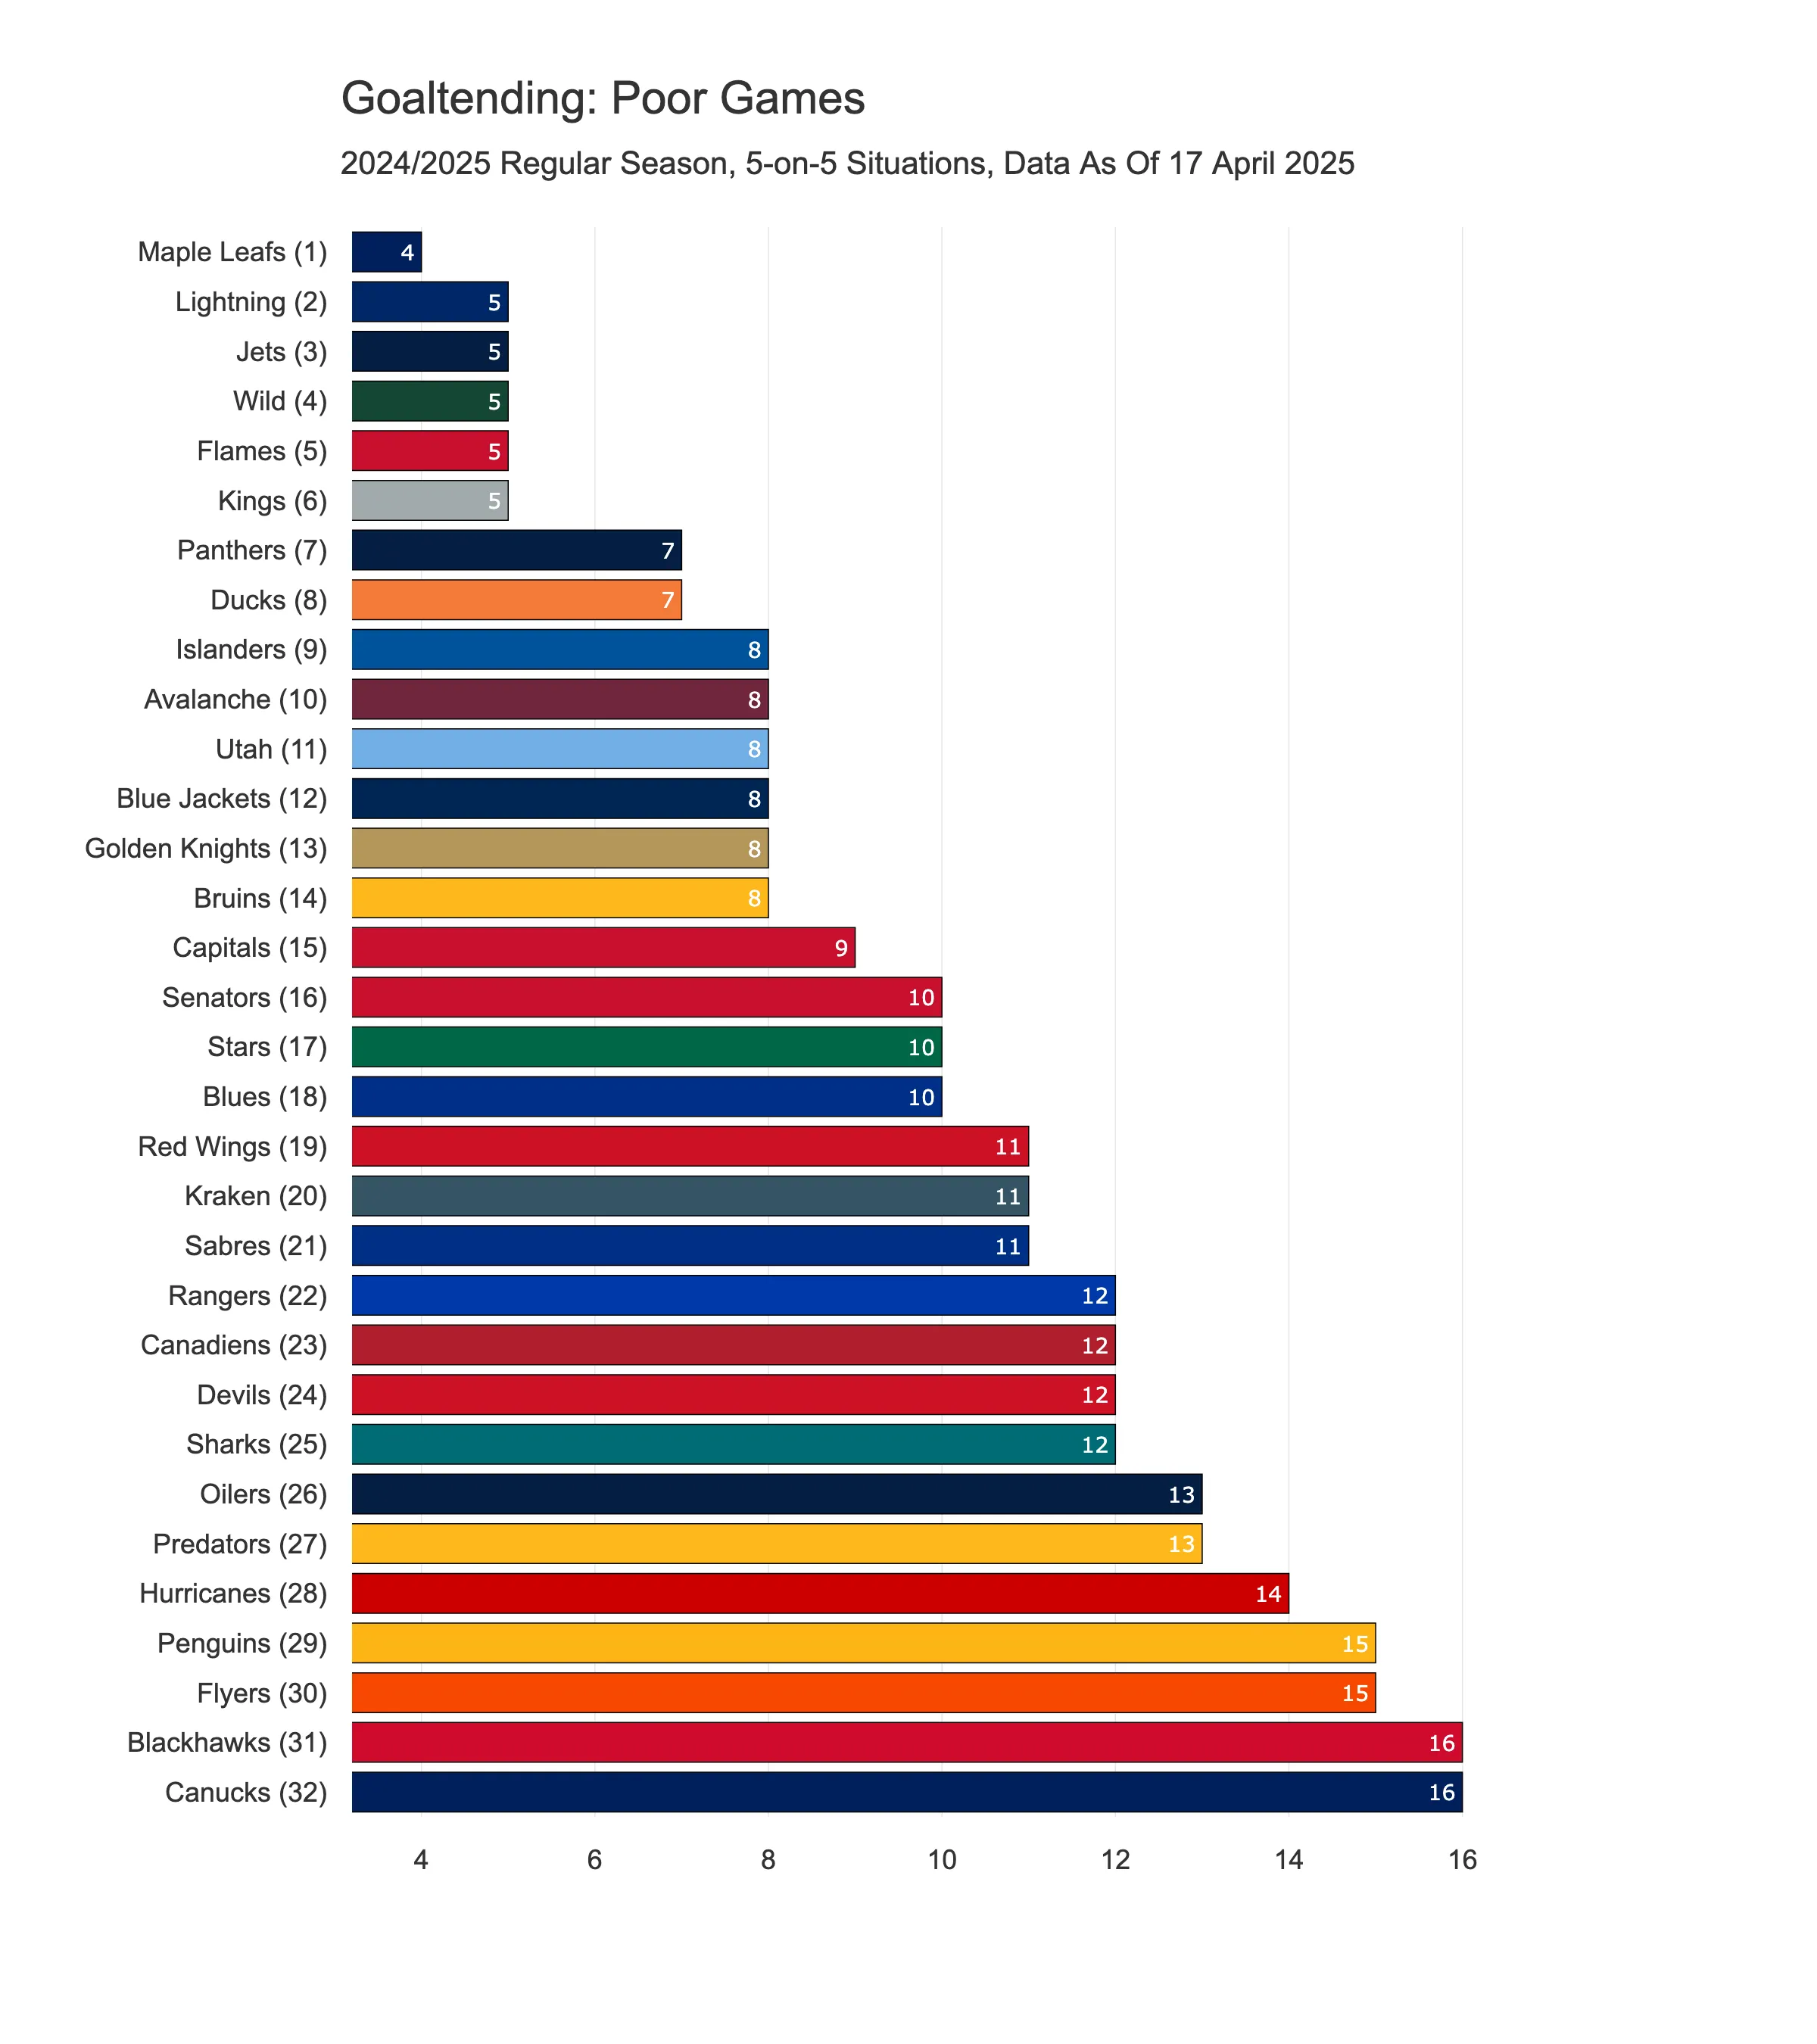
While stolen games highlight the brilliance of a goaltender’s performance, there are times when a goalie’s efforts fall short, and their team struggles as a result. These are what we refer to as poor games—games where the goaltender’s performance is below expectations, leading to a loss for their team.
Again, the definition of a poor game is not very clear, and every author has their own version of it. In my application, a poor game is added to a goalie if they meet one of the following criteria.
- Based on Goals Saved Above Expected (GSAx): If a goaltender’s GSAx is less than -2.0, meaning they allowed 2 more goals than expected, this is considered a poor game.
- Based on Save Percentage and Shots Faced: If a goaltender has a save percentage of less than 85% and faces fewer than 20 shots on goal, it indicates a poor performance, as the goalie has not been able to stop enough of the shots they were facing.
Now, when we look at both stolen games and poor games together, we get a decent picture of a goaltender’s consistency over the season. Take the Jets and the Lightning, for example. Their goalies posted a solid number of stolen games while keeping their poor performances to a minimum—which suggests their teams could have relied on their goalies’ performance throughout the year.
Then there are teams like the Maple Leafs, Wild, and Kings. These teams didn’t rack up loads of stolen games, but they also had very few poor ones. That tells us their goalies might not have been winning games single-handedly, but crucially, they weren’t losing them either. Steady, mistake-free goaltending—that sounds like consistency to me.
And then… there are teams like the Rangers. They recorded a lot of stolen games and a high number of poor ones. That kind of split points to one thing: inconsistency. When they were good, they were brilliant—but when they were off, it really showed.
Goaltending Rankings: The Best and Worst NHL Teams
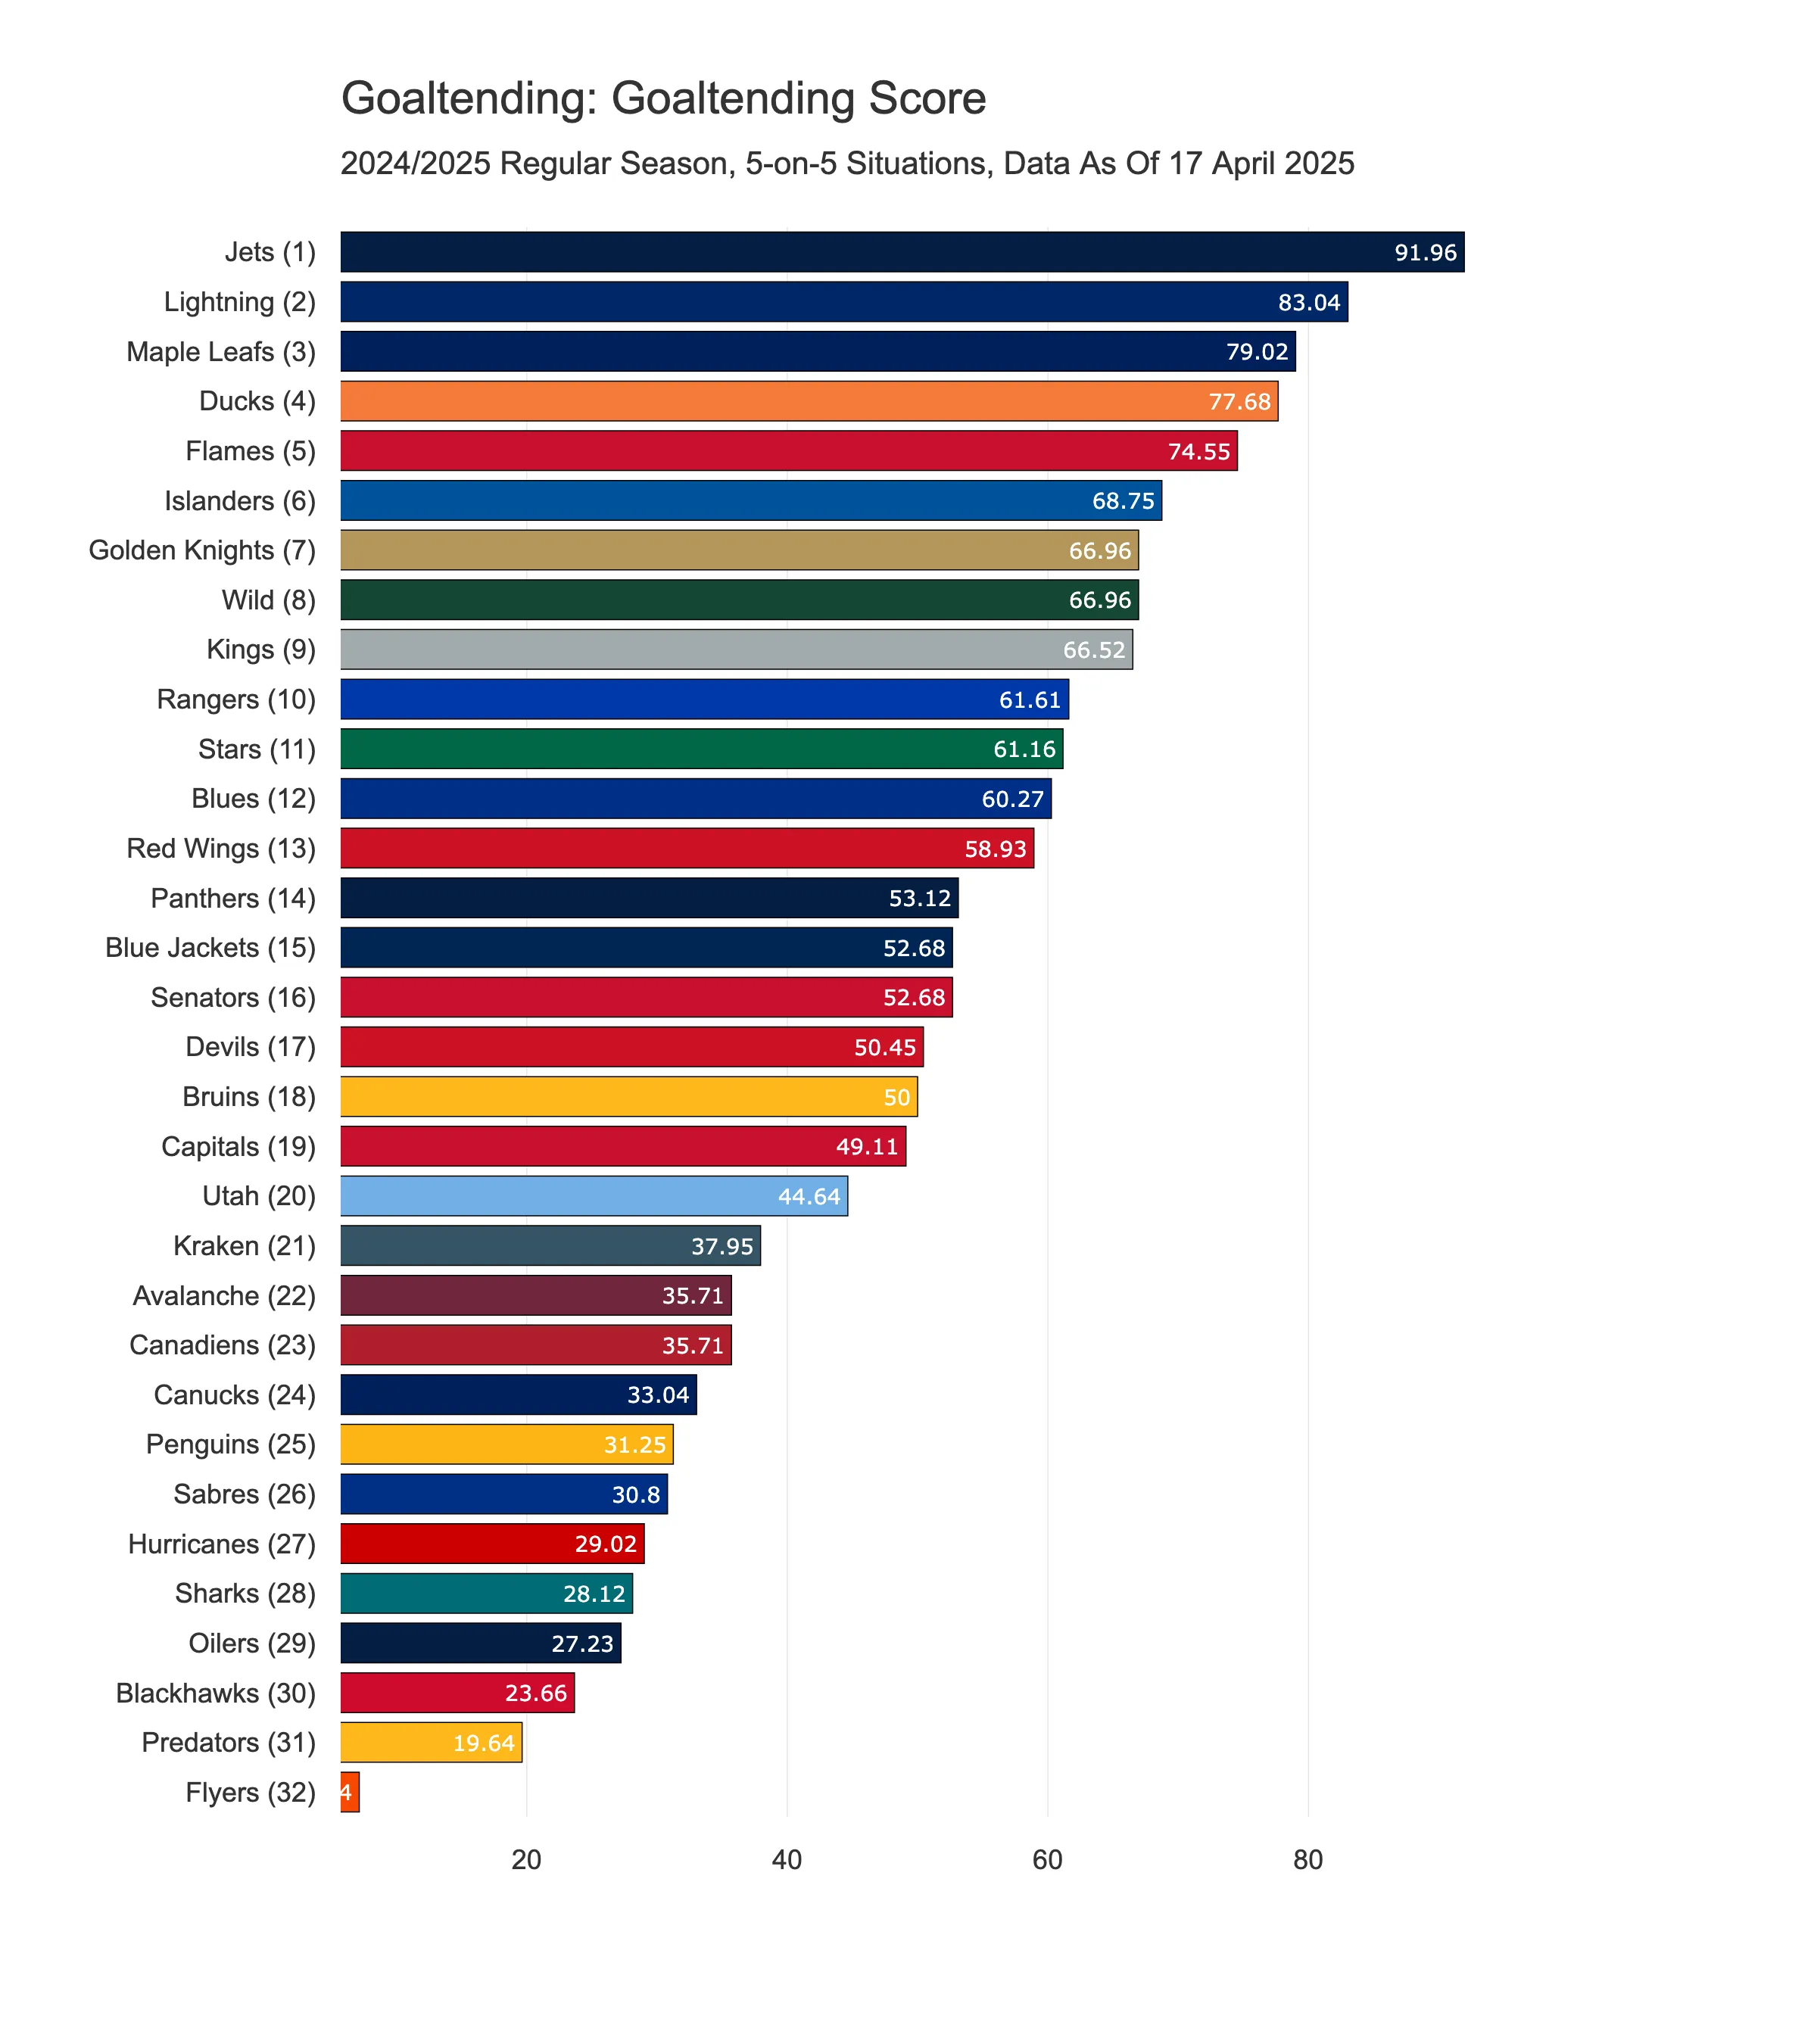
Each team was ranked in these six categories, assigned a percentile score for each, and then averaged to create a final Goaltending Score.
Key Takeaways
Elite Teams
The Jets, Lightning, Maple Leafs, Ducks, and Flames are the top five teams in the Goaltending Score!
There’s probably no surprise with the top two spots. Both the Jets and Lightning had outstanding goaltending this season. The Jets are mainly represented by Connor Hellebuyck, who is widely considered the frontrunner for his third Vezina Trophy this year. The Lightning, on the other hand, can count on the services of Andrei Vasilevskiy, a two-time Stanley Cup winner. Both teams have excelled in save percentage for high-danger shots, with numerous “stolen” games and very few poor games. I believe the Jets and Lightning have incredible weapons in their netminders, and I’m excited to see how they perform in the playoffs!
The Ducks are the only team in the top five that hasn’t made the playoffs. However, as we can see, they boast a strong goaltending tandem in Lukas Dostal and John Gibson. They rank best in save percentage for mid-danger shots, have a solid number of stolen games, and a low number of poor games. This is particularly impressive considering they allowed the most shots on goal this season and had the highest Expected Goals Against per 60 minutes. If the Ducks’ goalkeepers can maintain this level of performance and their defense improves, they could very well be a team contending for a playoff spot in the Western Conference next season!
Struggling Teams
The story in Philadelphia this year is completely different. According to the numbers, the Flyers’ defense was quite solid—they ranked 11th in the league for Defense Score. However, their goaltending was so poor that their score didn’t even fit into the bar on the chart above! They ranked last in save percentage for high-danger shots and had 15 poor games. To make matters worse, they were the only team without a single stolen game! I think the Flyers’ goaltending was a major reason for their struggles this season and perhaps even one of the factors behind John Tortorella’s end on the bench. But, of course, that’s just speculation on my part!
The worst team in the Goaltending Score that still made the playoffs is the Oilers. And when we consider all the stats from the previous articles, we see the same old story: the Oilers have a stellar offense, average defense, and poor goaltending. In other words, they’ll likely rely on their offensive powerhouse to score plenty of goals while hoping their goaltenders allow at least one fewer… Sorry for the jokes, but I’m genuinely excited to see the Oilers face off against the Kings in the playoffs once again. This time, however, I don’t expect the series to be as one-sided as last year! Unfortunately, another factor that could influence this matchup is the Oilers’ list of injuries.
Final Thoughts
Goaltending can level the playing field or tip the scales entirely. It’s probably the most volatile and impactful position in hockey—and understanding it requires more than just box score stats. These rankings aim to spotlight those goalies who truly made a difference this season.
In the final article of this series, we’ll bring it all together by combining offense, defense, and goaltending scores to reveal the most complete teams in the NHL!
Stay tuned for the last part of this series: Overall Team Rankings!