· Jaroslav Bezdek · Analysis · 11 min read
The NHL Team Rankings: Offense
Which teams created the most scoring chances during the 2024/2025 regular season? And which teams converted those chances into goals most efficiently? Let's find out!

With the 2024/2025 regular season winding down, it’s time to analyze which teams have been the most dangerous offensively. Scoring goals is the most exciting part of hockey, but raw goal totals don’t always tell the full story. To get a deeper understanding, I ranked all 32 NHL teams using a comprehensive Offense Score, built from several advanced statistics.
Offense Related Statistics
To evaluate each team’s offensive ability, I used the following metrics that in the end equally contributed to Offense Score.
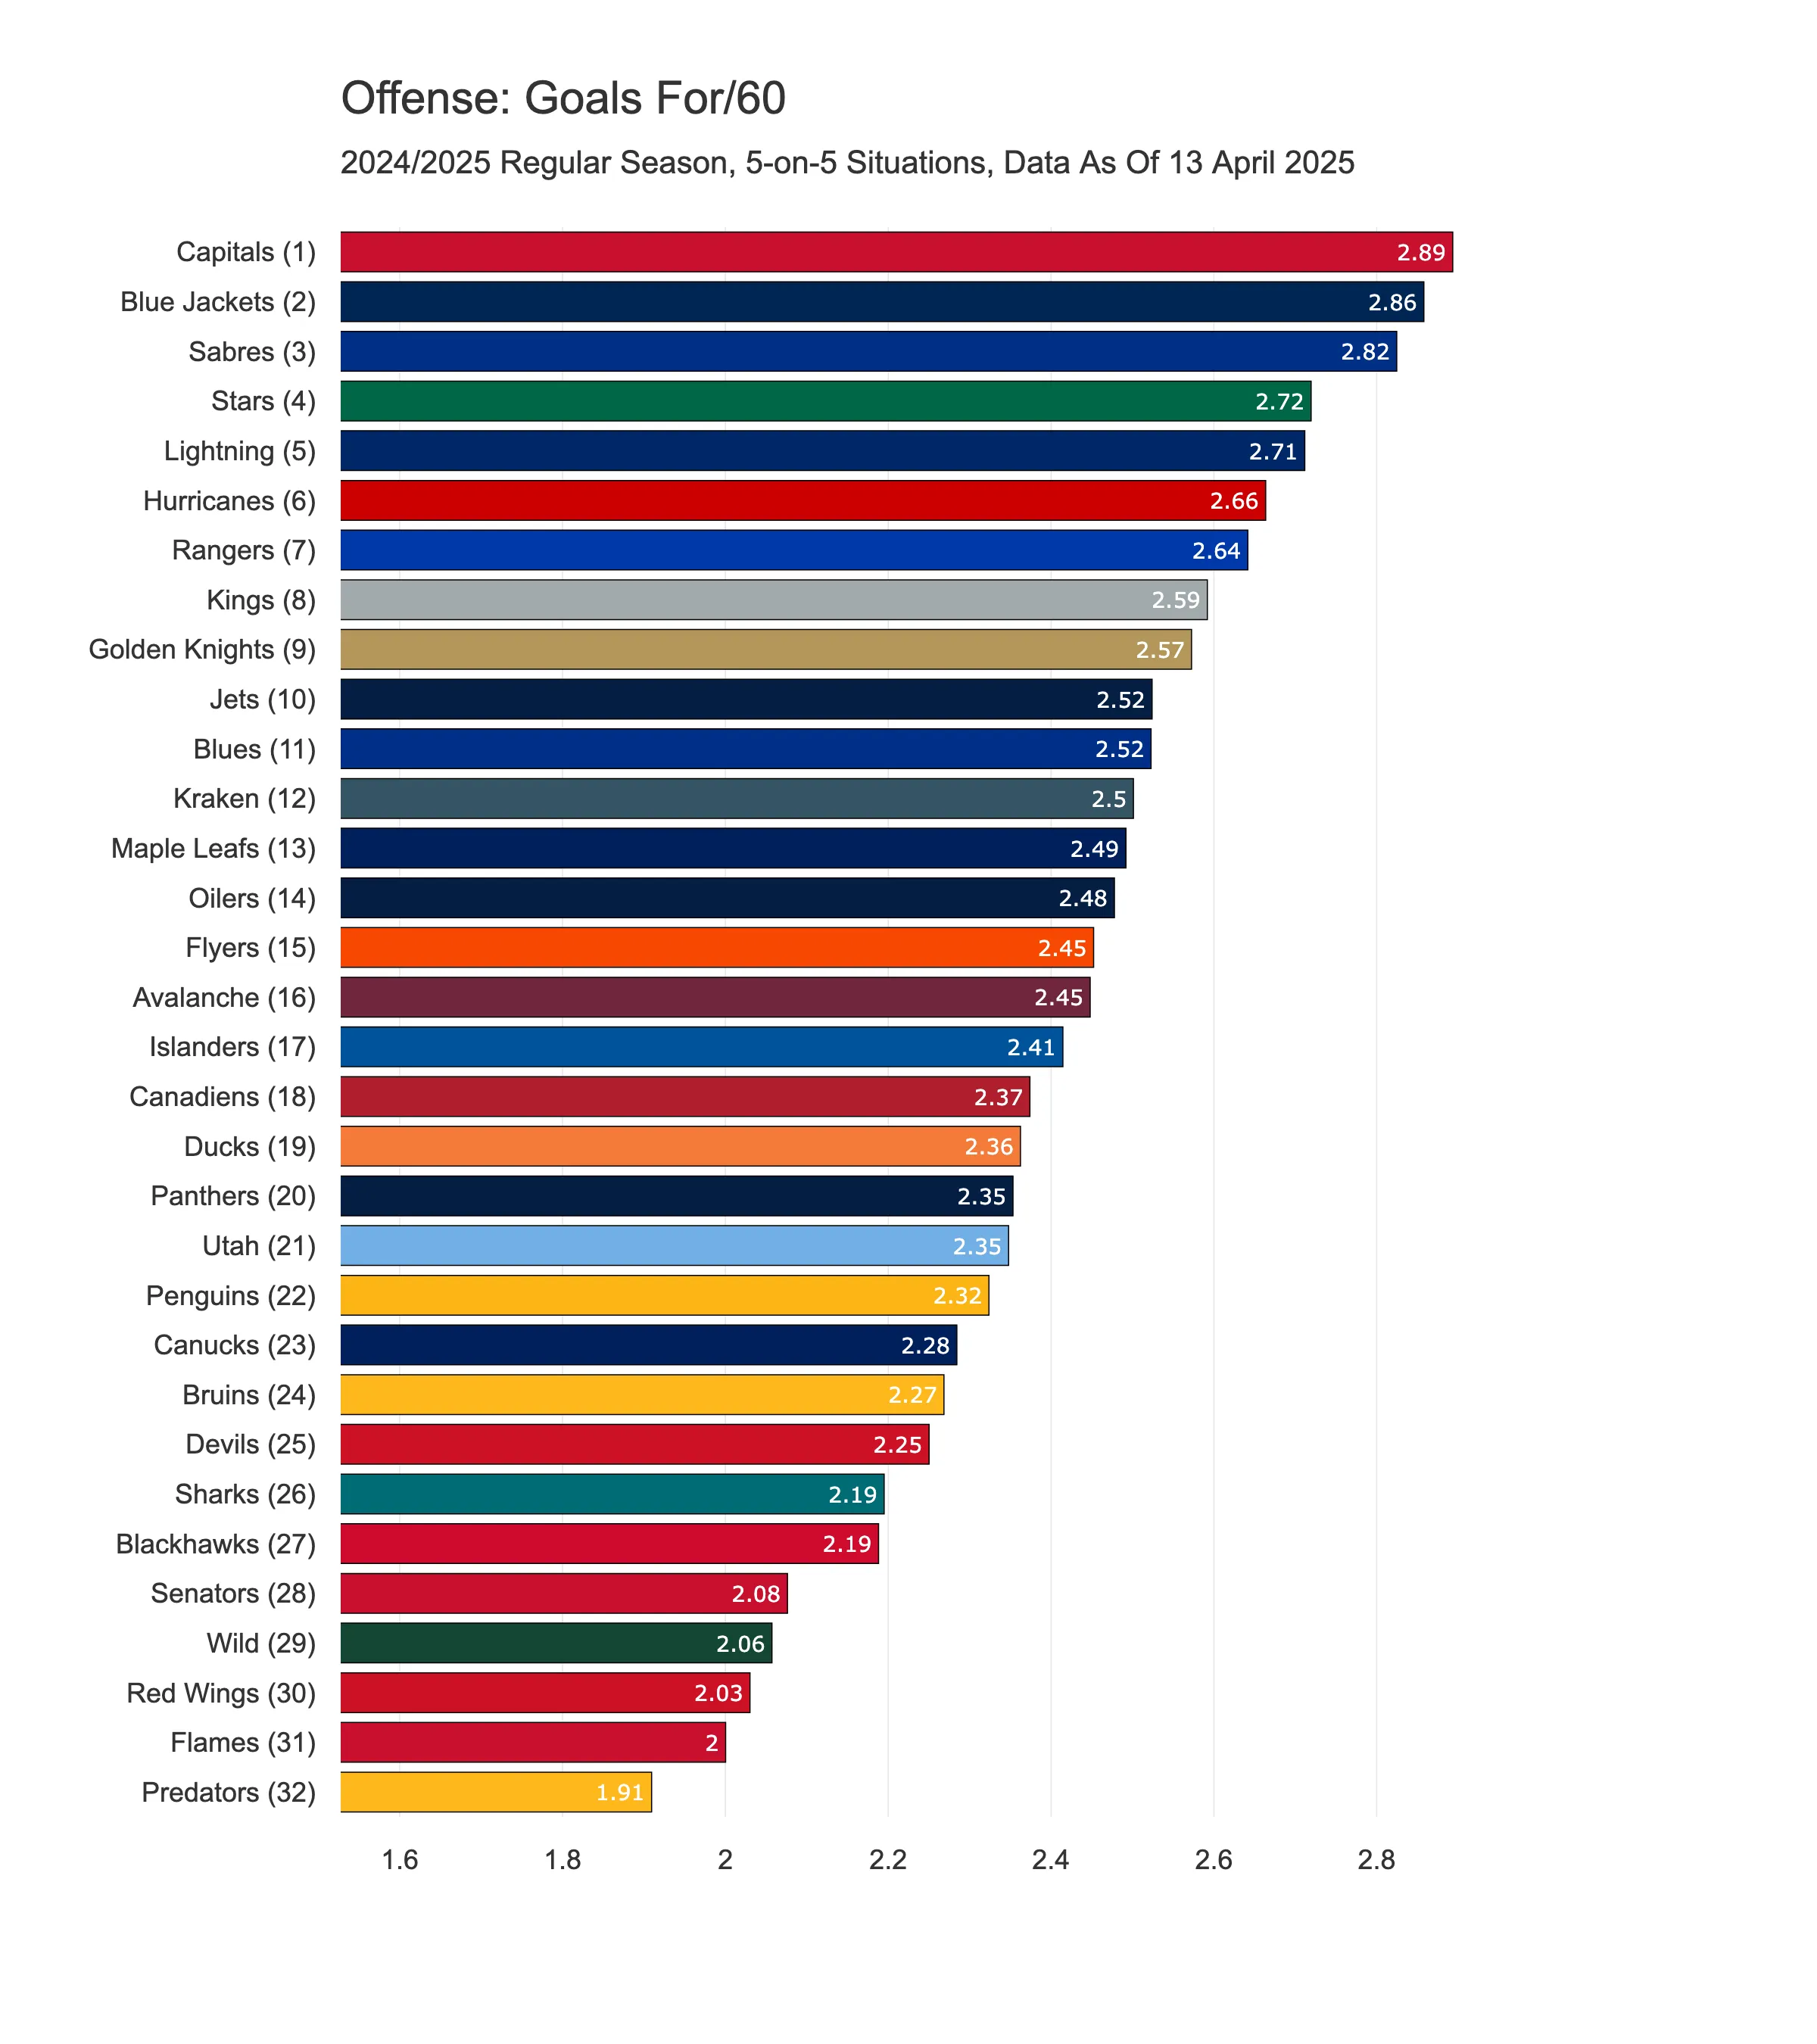
1) Goals For/60
This metric shows how many goals a team scores per 60 minutes at 5-on-5.
According to the chart below, the most frequent scorers are largely based on the East Coast, with the Capitals leading the way. A bit of a surprise is seeing the Sabres in third place, as that doesn’t quite match their position in the overall NHL standings. Another unexpected result for me was not seeing the Avalanche ranked a bit higher—especially for a team known for its high-powered offence. That said, the stat reveals something interesting: although the Avalanche are among the top teams in total goals scored, they don’t score as frequently during 5-on-5 play compared to others.
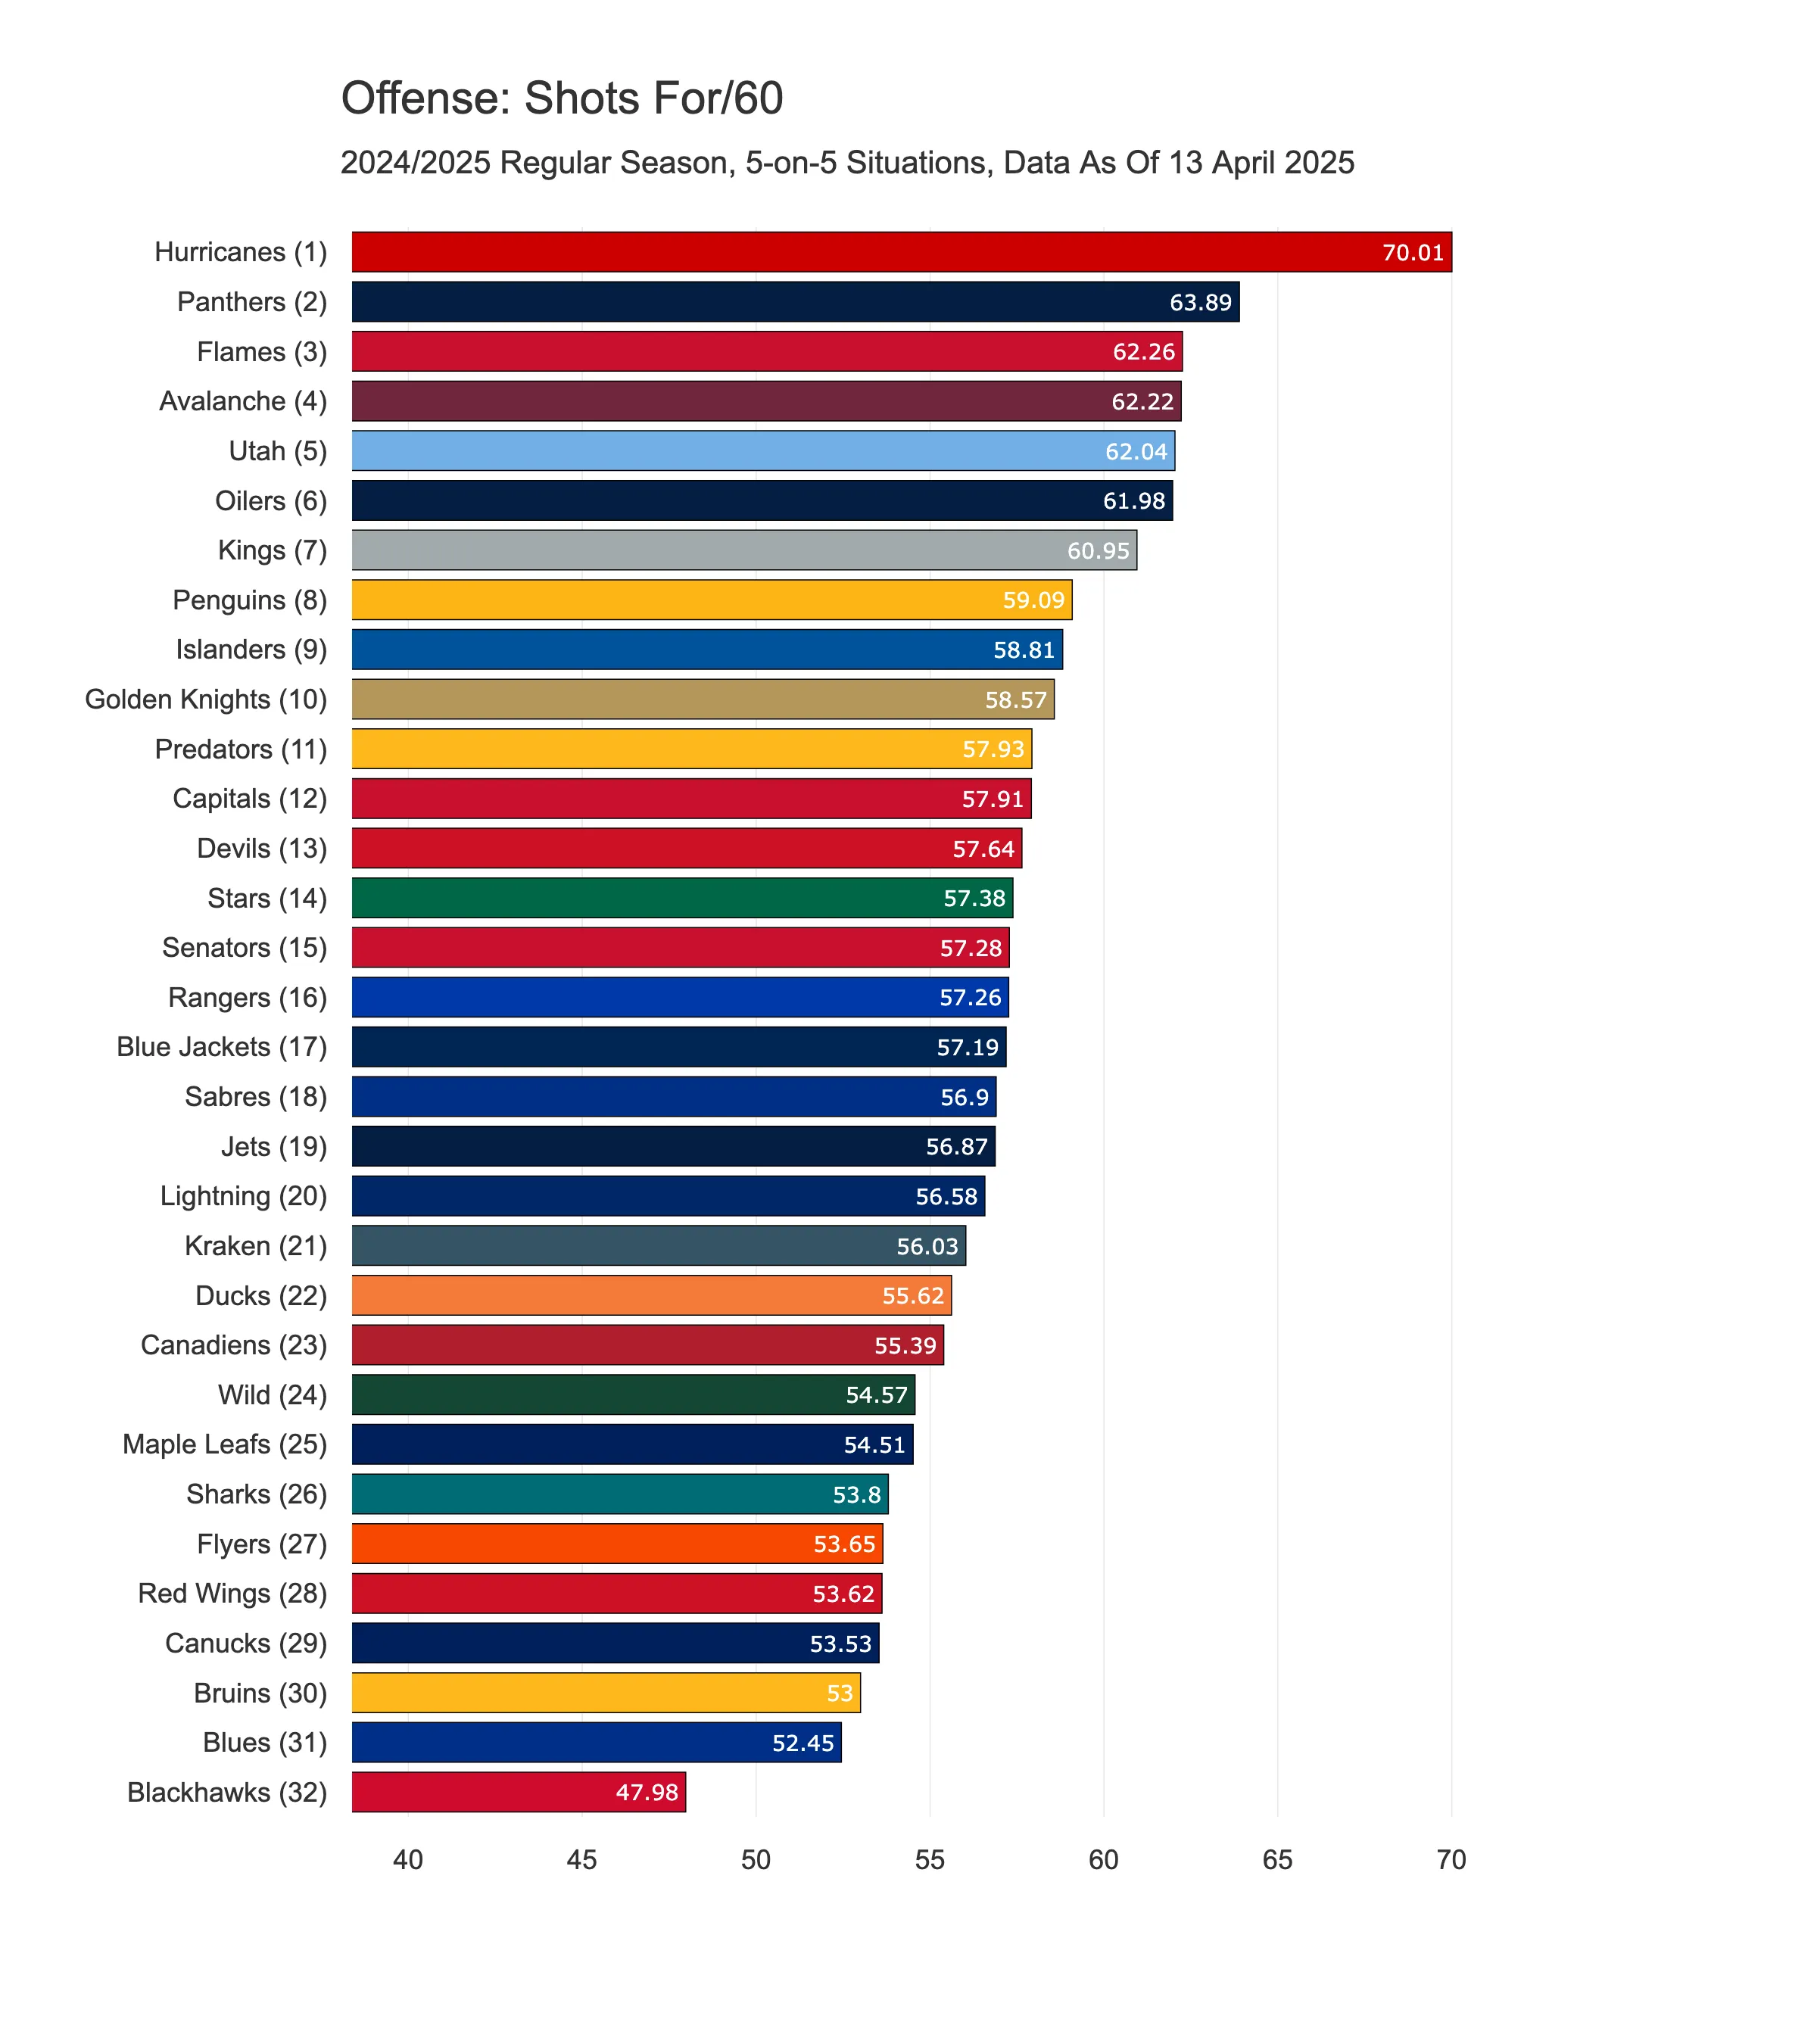
2) Shots For/60
This metric shows how frequently teams shoot towards the opponent’s goal. It includes all types of attempts—goals, shots on target, missed shots, and blocked shots—which explains the relatively high numbers.
However, since it only reflects the number of shots and not their quality, this metric does have its limitations. The Hurricanes may seem impressive in terms of volume, but are they really creating dangerous chances—or just firing the puck whenever they can? On the flip side, the Blues are among the least active shooting teams in the league, but that doesn’t necessarily make them ineffective. In fact, they rank 11th in goals for per 60 minutes across the league, suggesting they’re simply more selective with their chances.
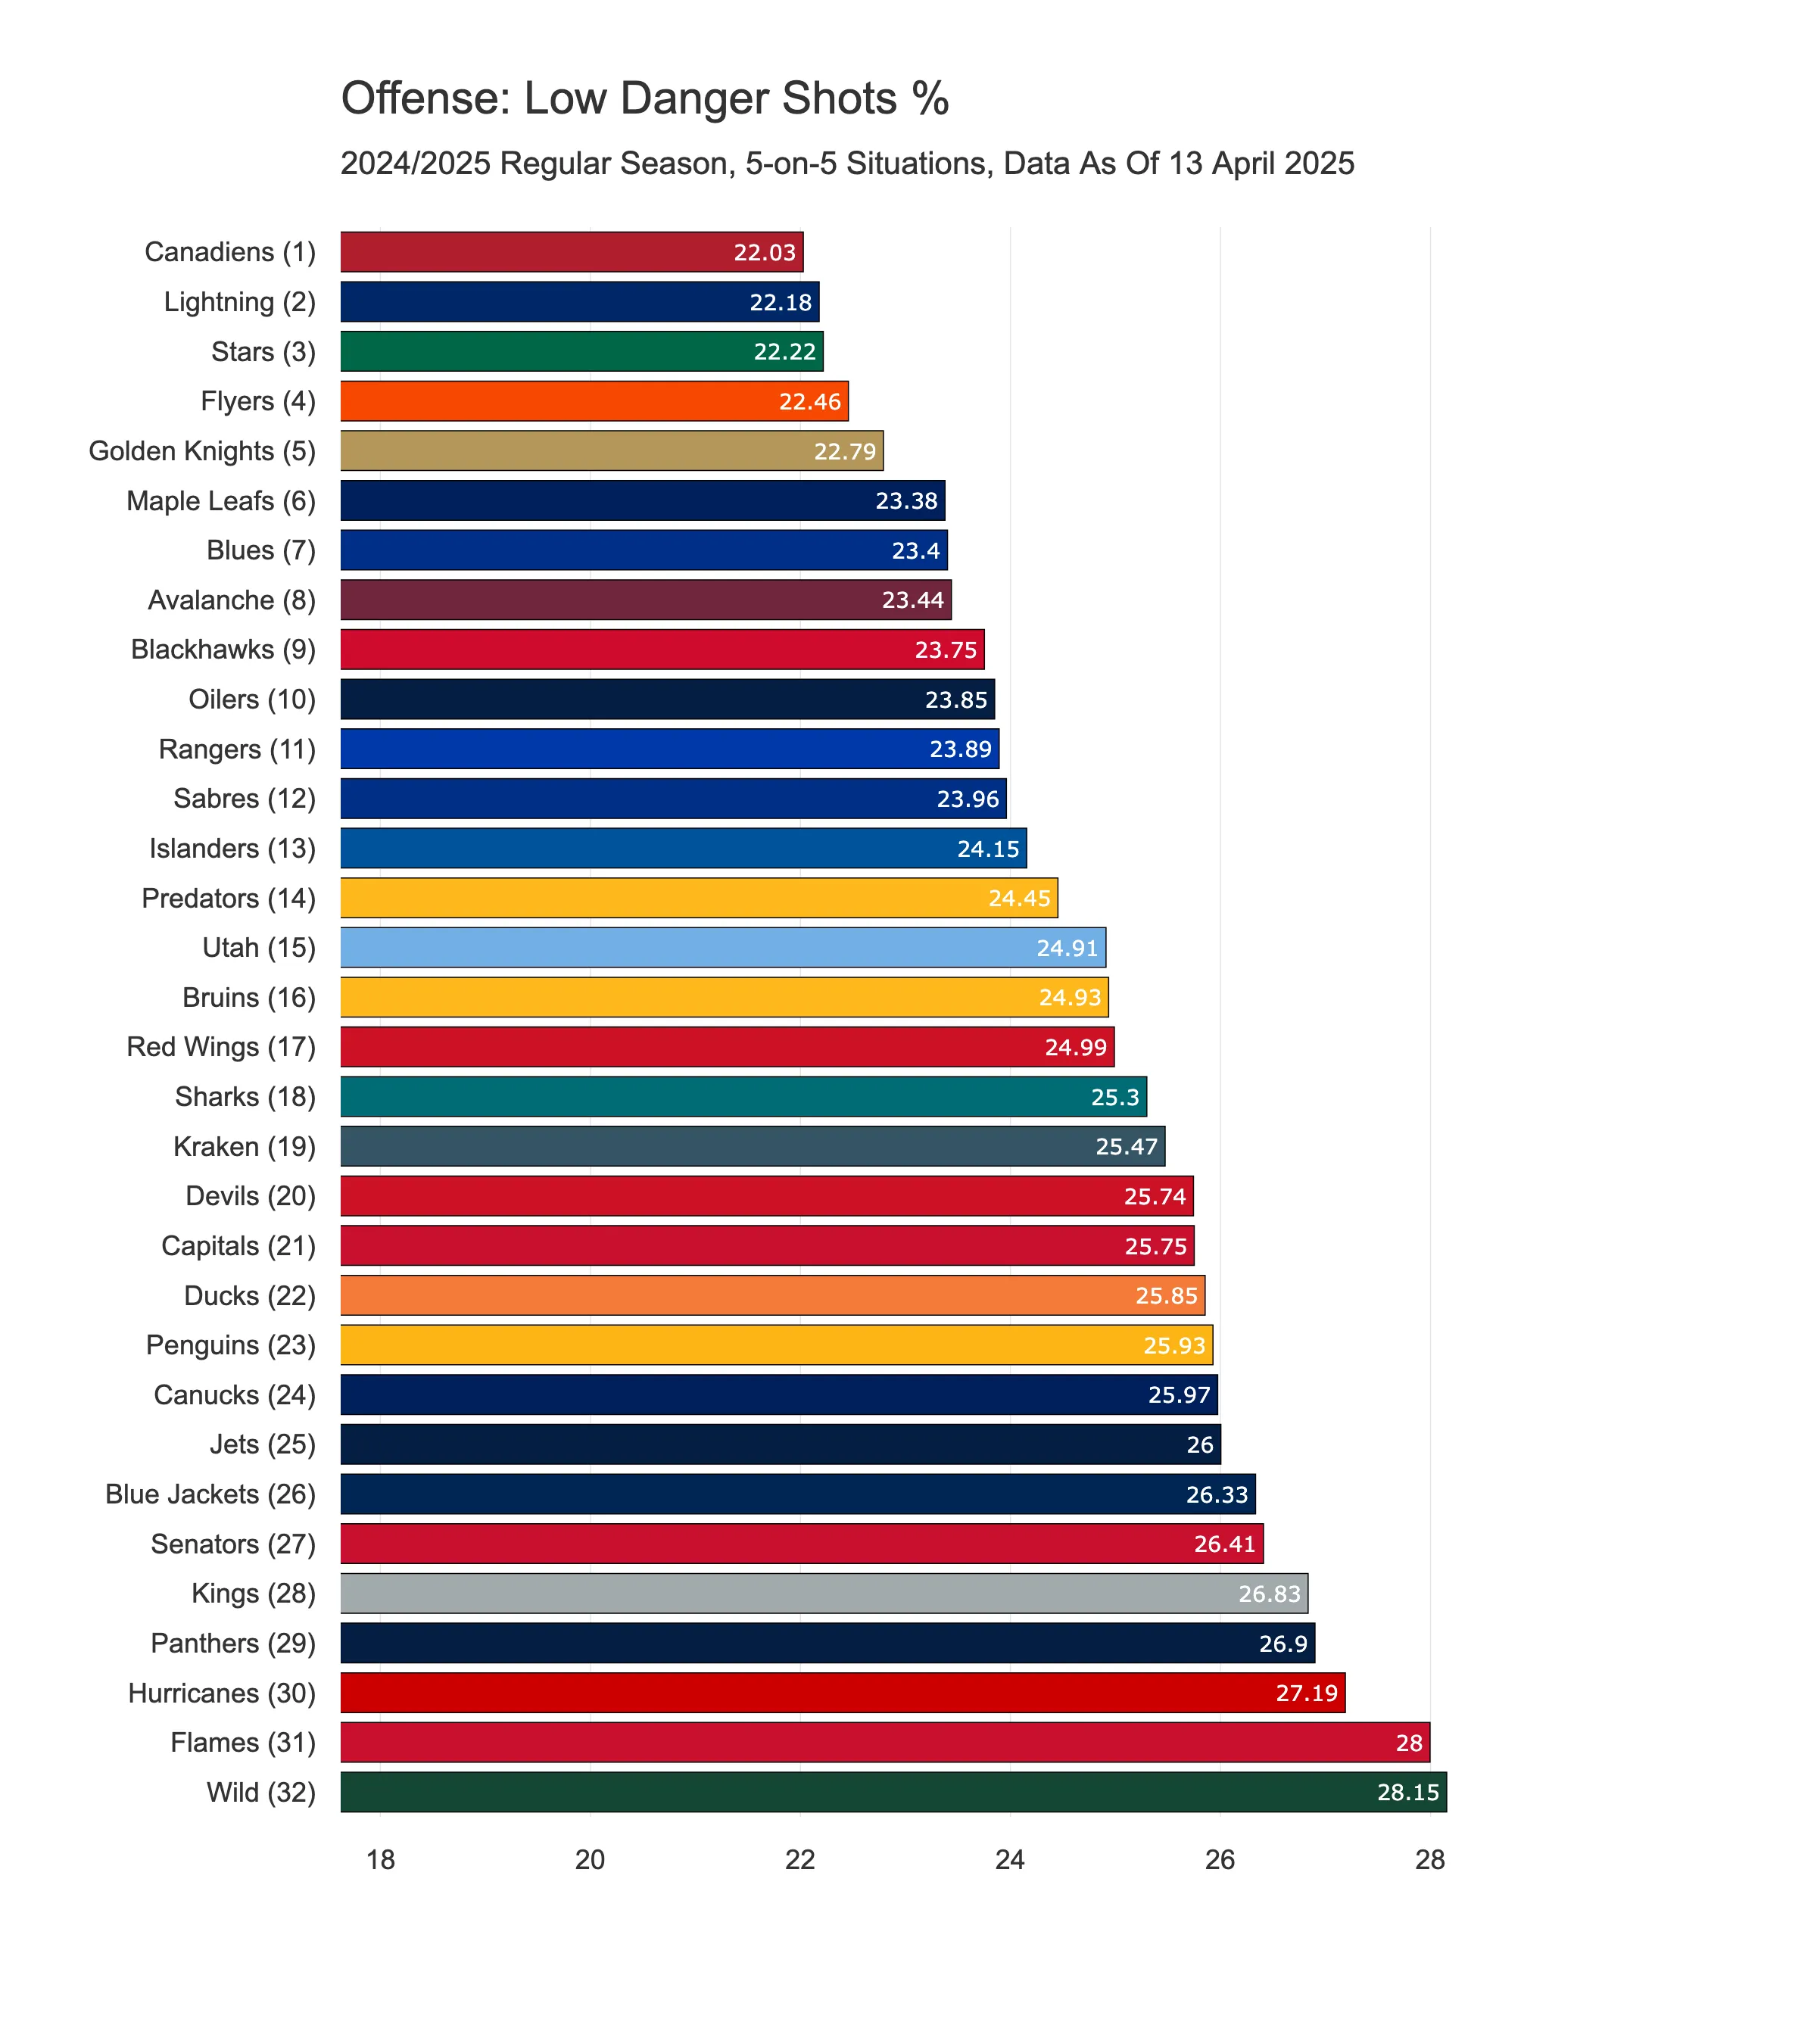
3) Low Danger Shots For %
To address the limitations of the Shots For/60 statistic (and also to find out if the Hurricanes are generating quality chances), I created two additional metrics that take shot quality into account: Low Danger Shots For % and High Danger Shots For %.
To explain what these metrics represent, I should first outline how they are calculated. So, first, I used my location-based xG model to assign each shot an xG value—a number representing the probability of that shot resulting in a goal. The higher the xG, the more dangerous or higher quality the shot is considered to be. Next, I sorted all shots from highest to lowest xG and I classified the top 25% as high-danger shots, the bottom 25% as low-danger shots, and the middle 50% as mid-danger shots.
Now, onto the metric Low Danger Shots For %. The idea here is simple: if we divide all shots across the league this way, an average team should have roughly 25% low-danger shots, 50% mid-danger shots, and 25% high-danger shots. However, if a team takes a high volume of shots but most of them are poor-quality, their share of low-danger shots will exceed 25%—and their high-danger shot share will likely fall below average.
This is exactly the case with the Hurricanes. While they take a lot of shots, the data suggests they’re prioritising quantity over quality.
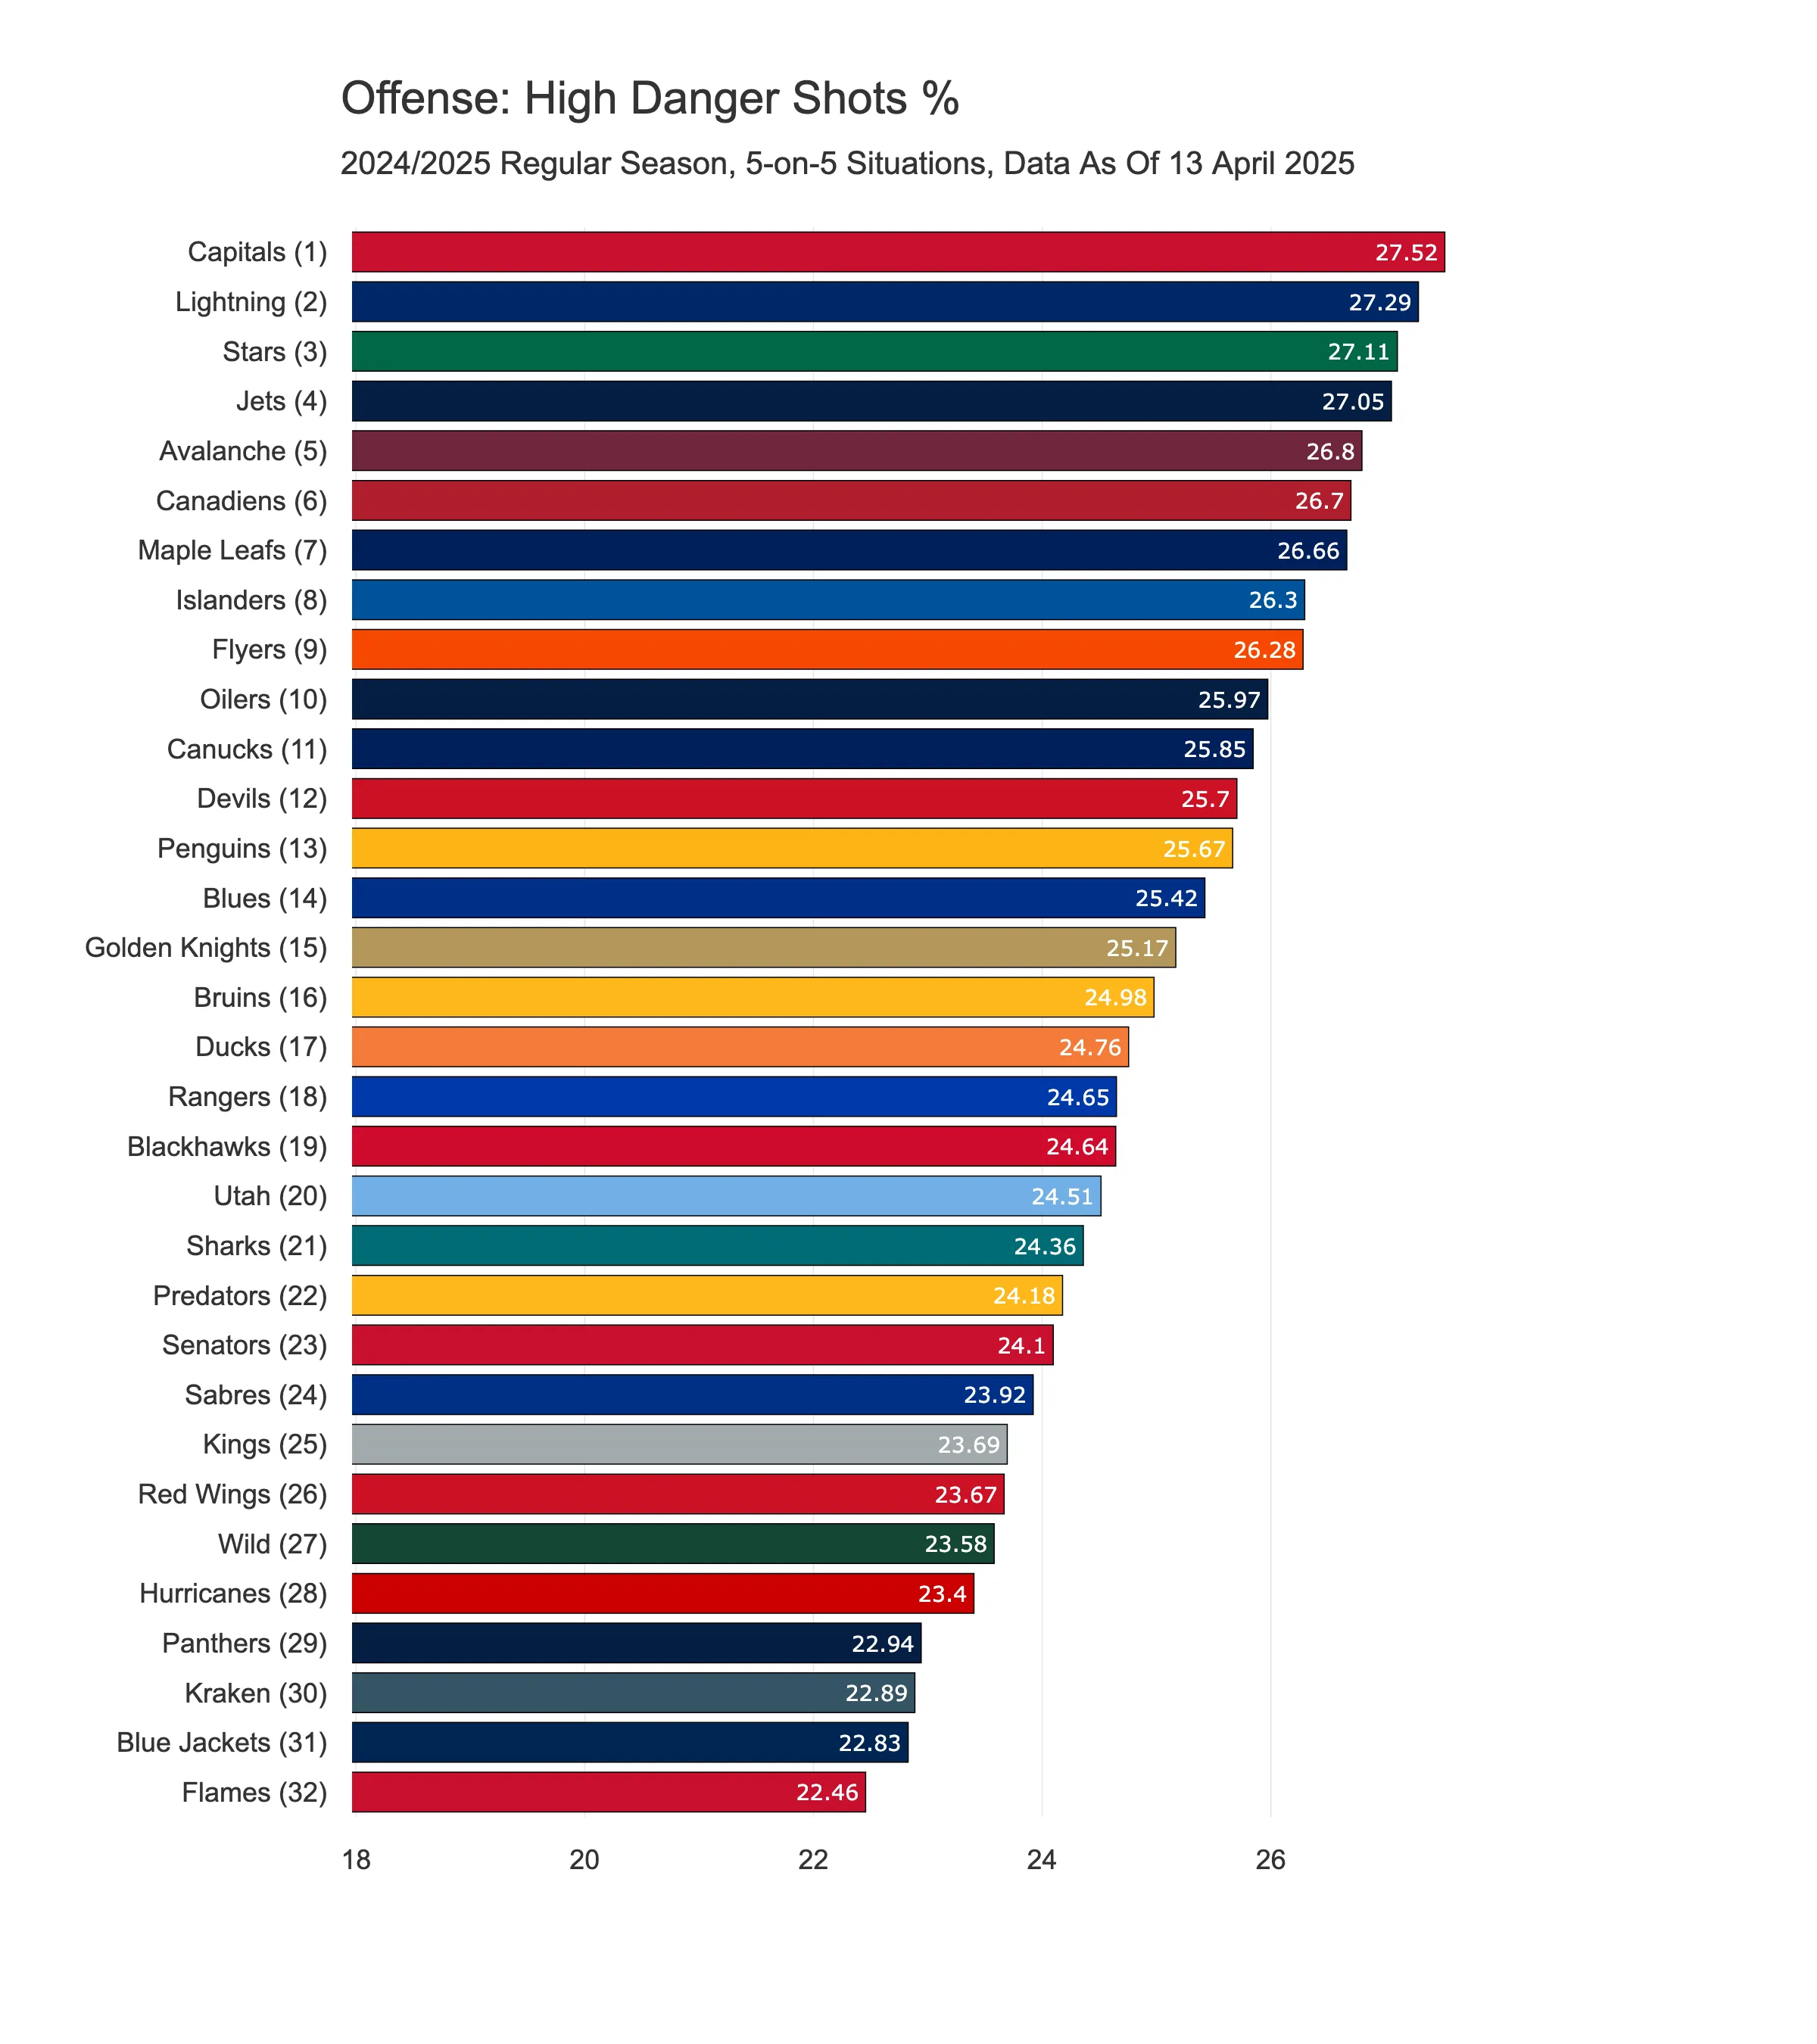
4) High Danger Shots For %
At the other end of the spectrum is a statistic called High Danger Shots For %, which reflects the proportion of a team’s shots taken from high danger areas. Teams that rank highly in this category can be seen as those that prioritise creating quality chances over simply taking lots of shots.
A particularly interesting case is the Golden Knights. Despite having the 5th lowest proportion of low danger shots, they’re only average when it comes to high danger attempts, suggesting they favour creating more mid-danger opportunities than most teams.
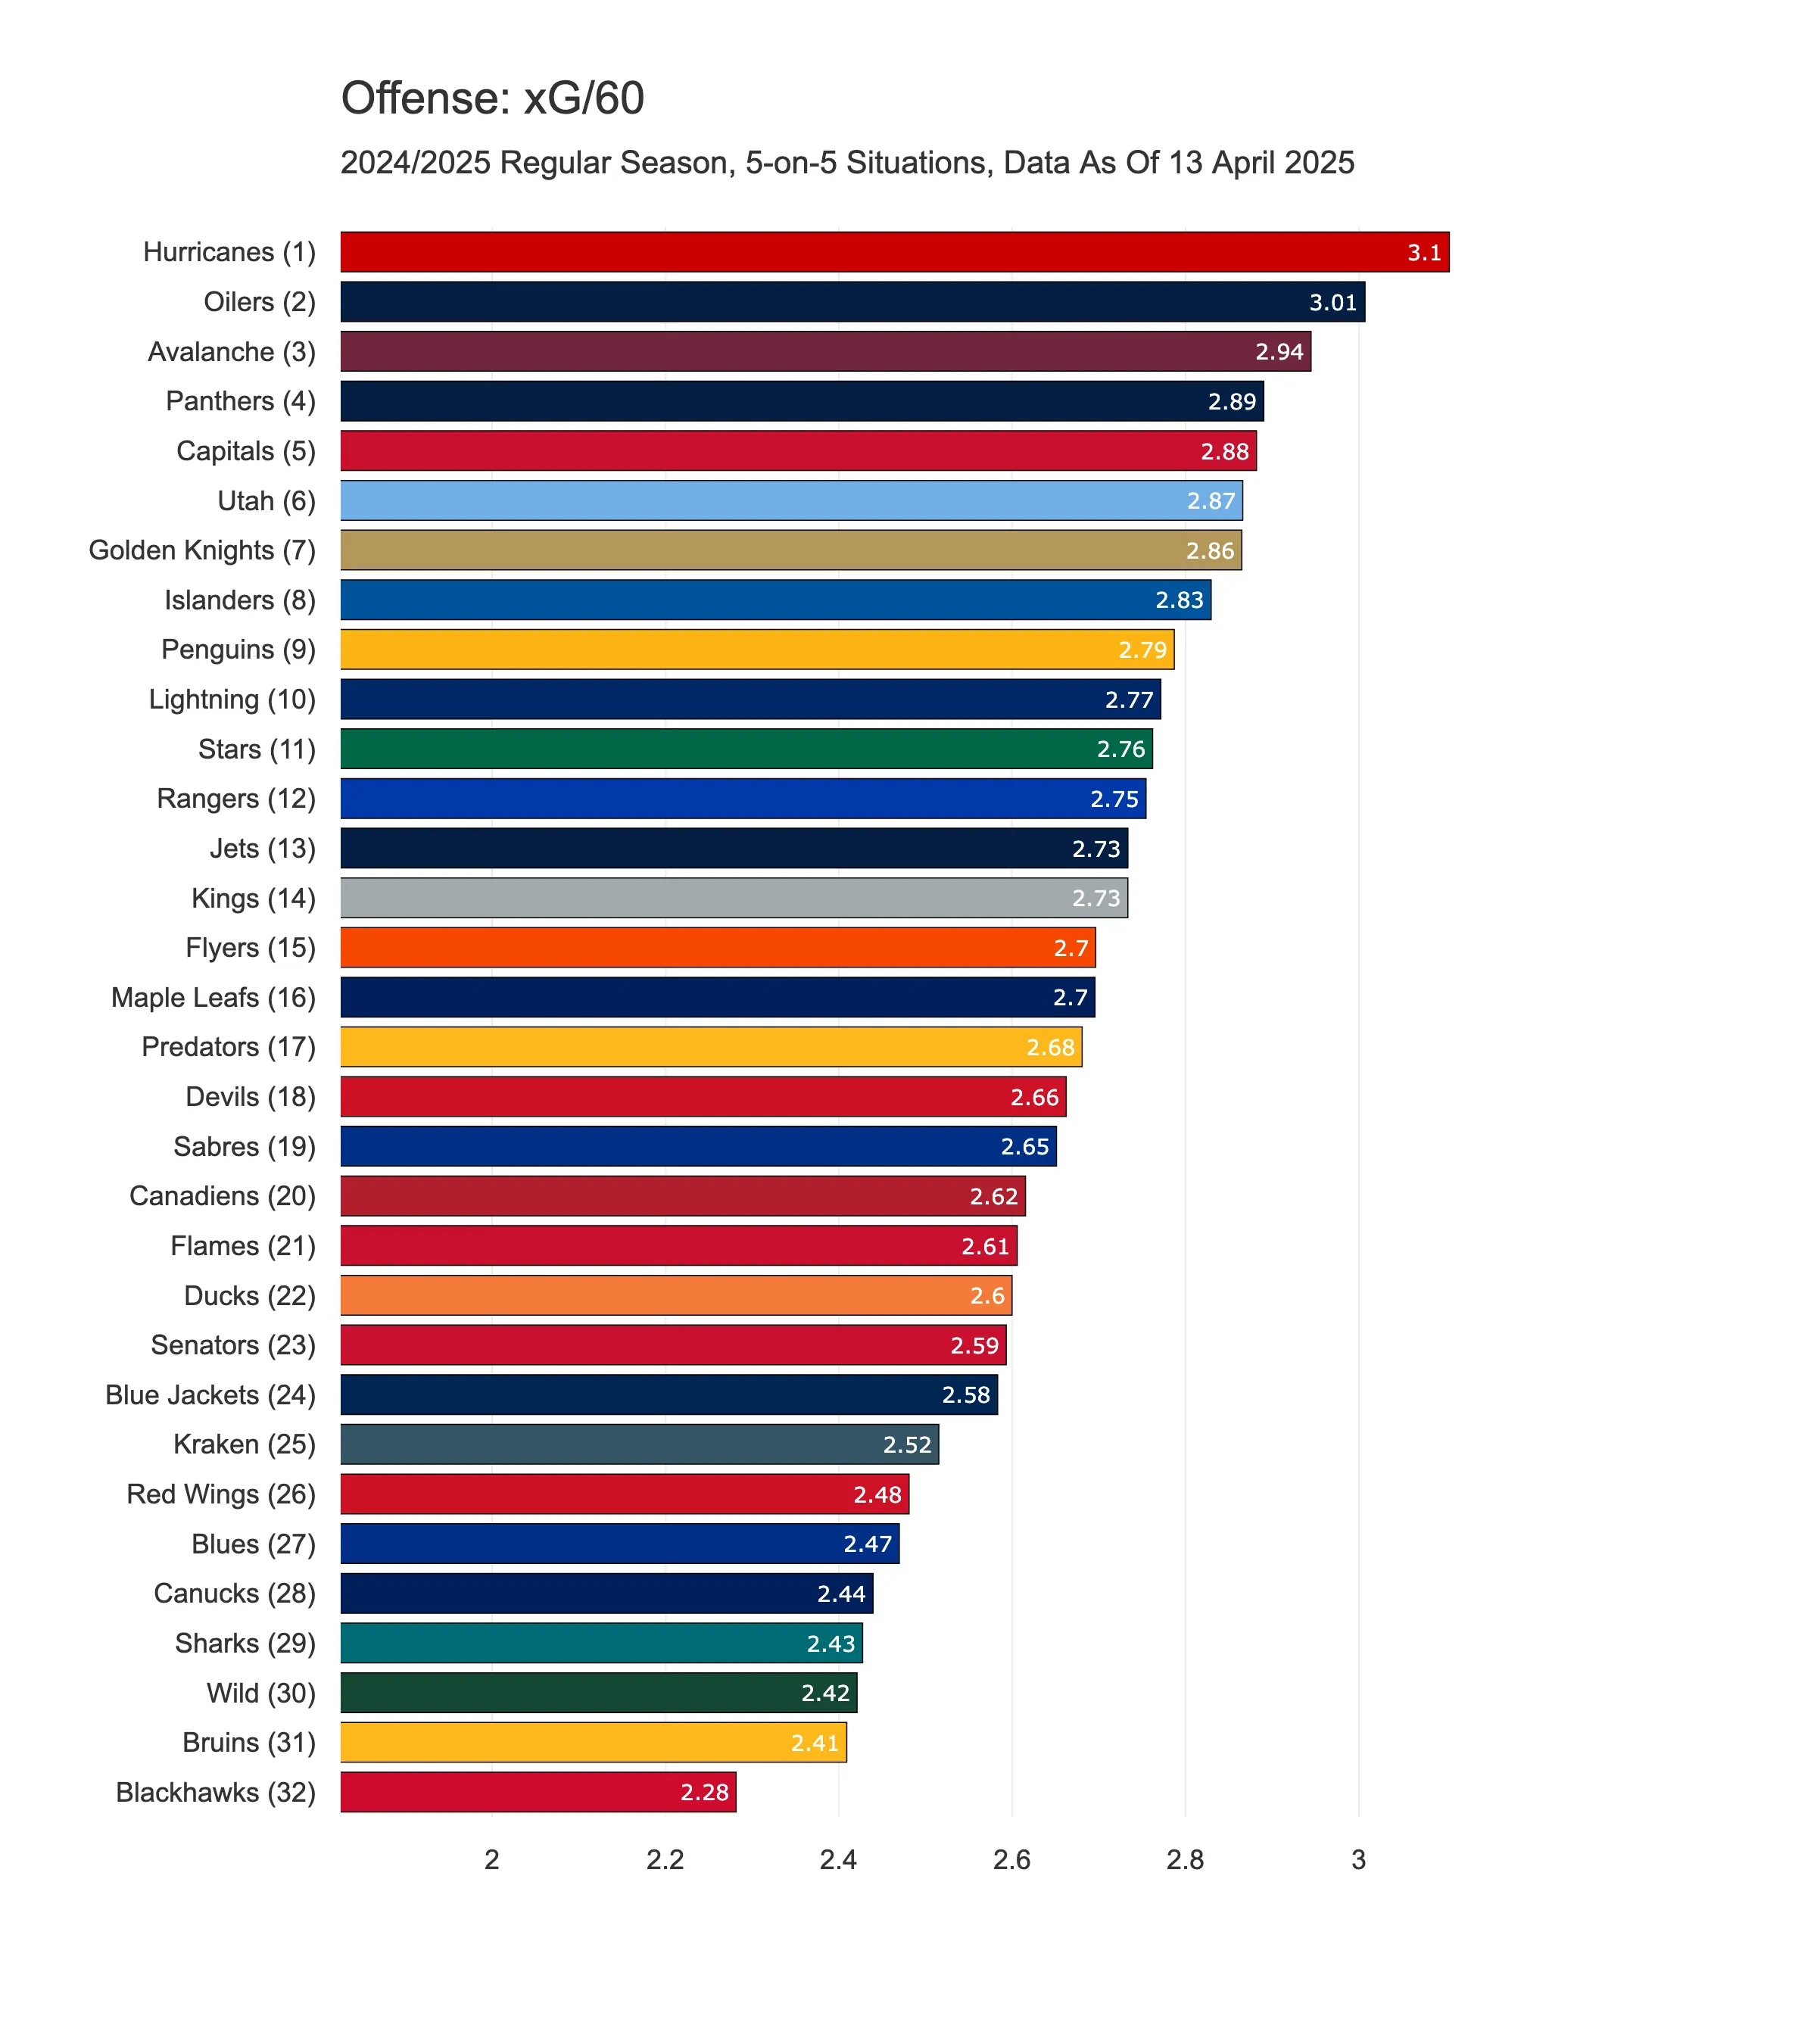
5) Expected Goals per 60
Previously, we looked at stats that focus solely on shot volume (Shots For/60) and shot quality (Low Danger Shots For % and High Danger Shots For %). Expected Goals per 60 combines both elements into a single figure, estimating how many goals an average player would be expected to score based on the quality and quantity of shots a team has taken over the course of the season.
From the chart below, it’s clear that although the Hurricanes generate a high number of shots—many of which aren’t necessarily high danger ones—the probabilities add up, putting them at the top of the table. Other strong-performing teams expected to score heavily include the Oilers and the Avalanche which are two powerhouses of the league, so no surprises there.
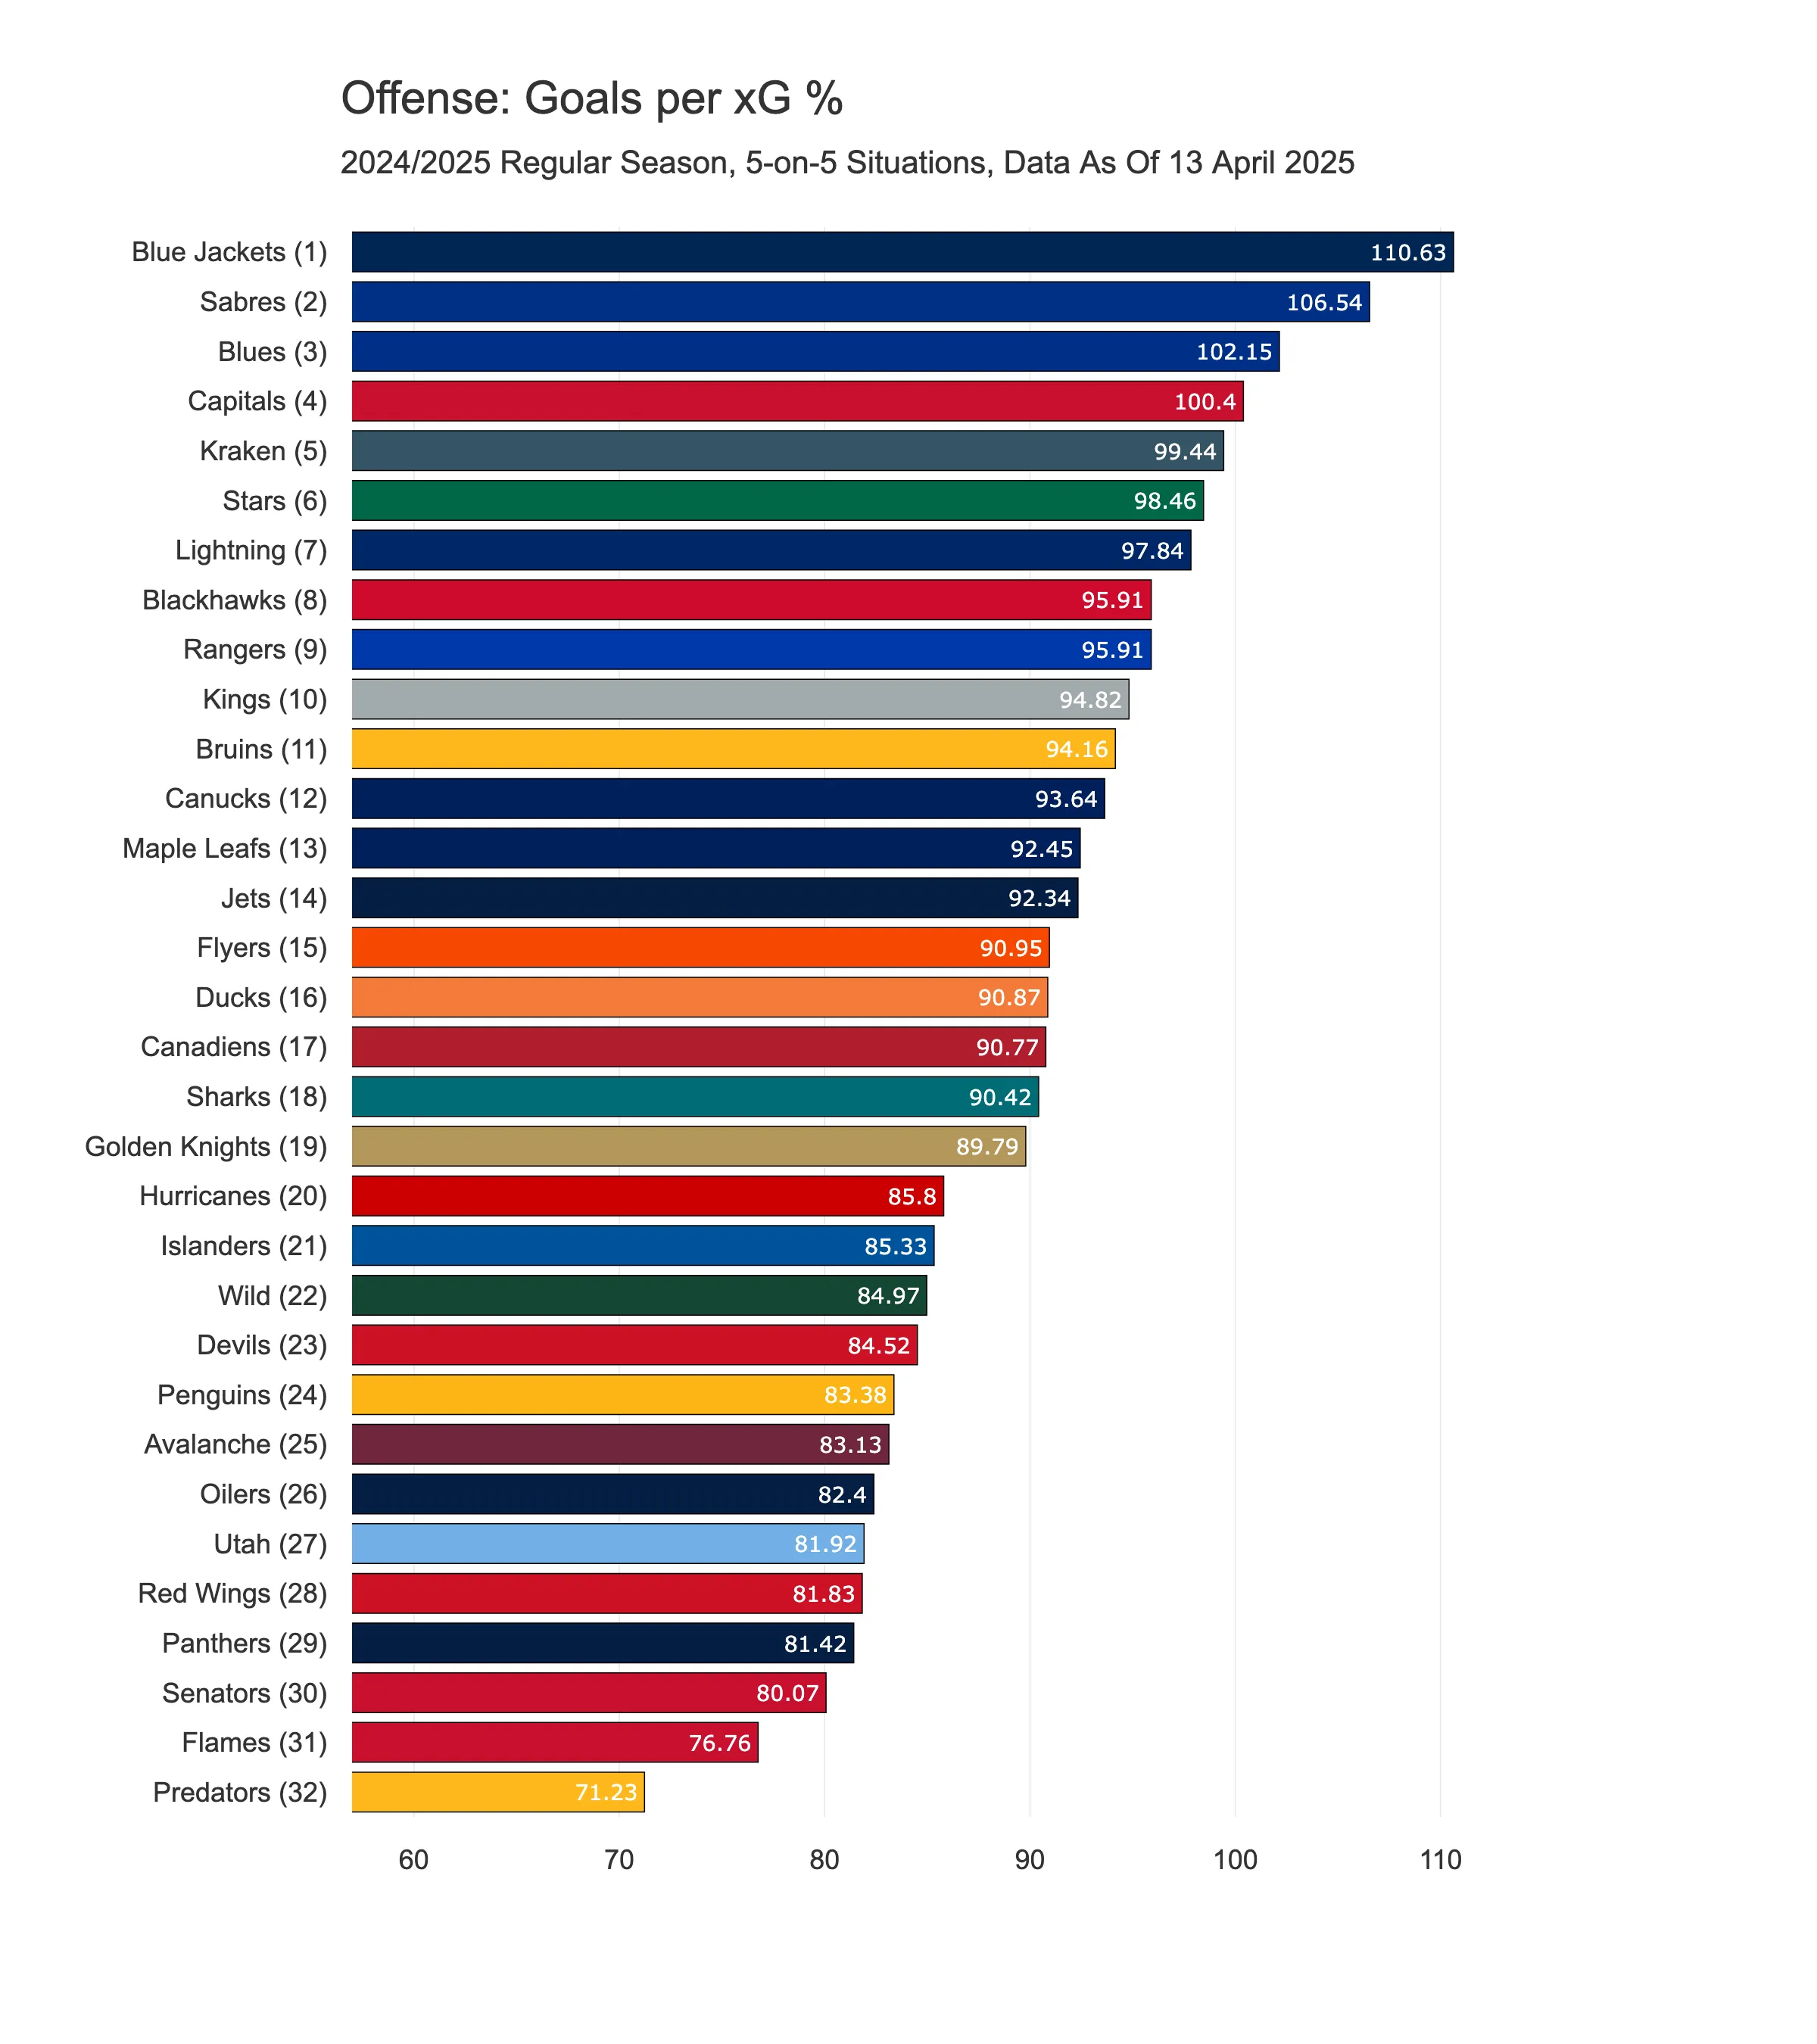
6) Goals per xG %
Combining shot volume and quality is great—but does it really tell us how efficient teams are at turning chances into actual goals? Not really.
That’s why I created a new stat called Goals per xG %, which compares the actual number of goals scored to the expected goals. You can think of it as the percentage of goals a team scores out of what they were expected to score. Teams that are more clinical in front of goal will have a value above 100%, while those that struggle to finish their chances will fall below that mark.
The results might be surprising, as they don’t quite reflect the league standings—especially when you see the Blue Jackets and Sabres topping the list. In fourth place are the Capitals, which isn’t too shocking, as they’ve got a player who’s among the very best in this stat on an individual level. I’m sure you already know who I’m talking about—yes, it’s Alex Ovechkin.
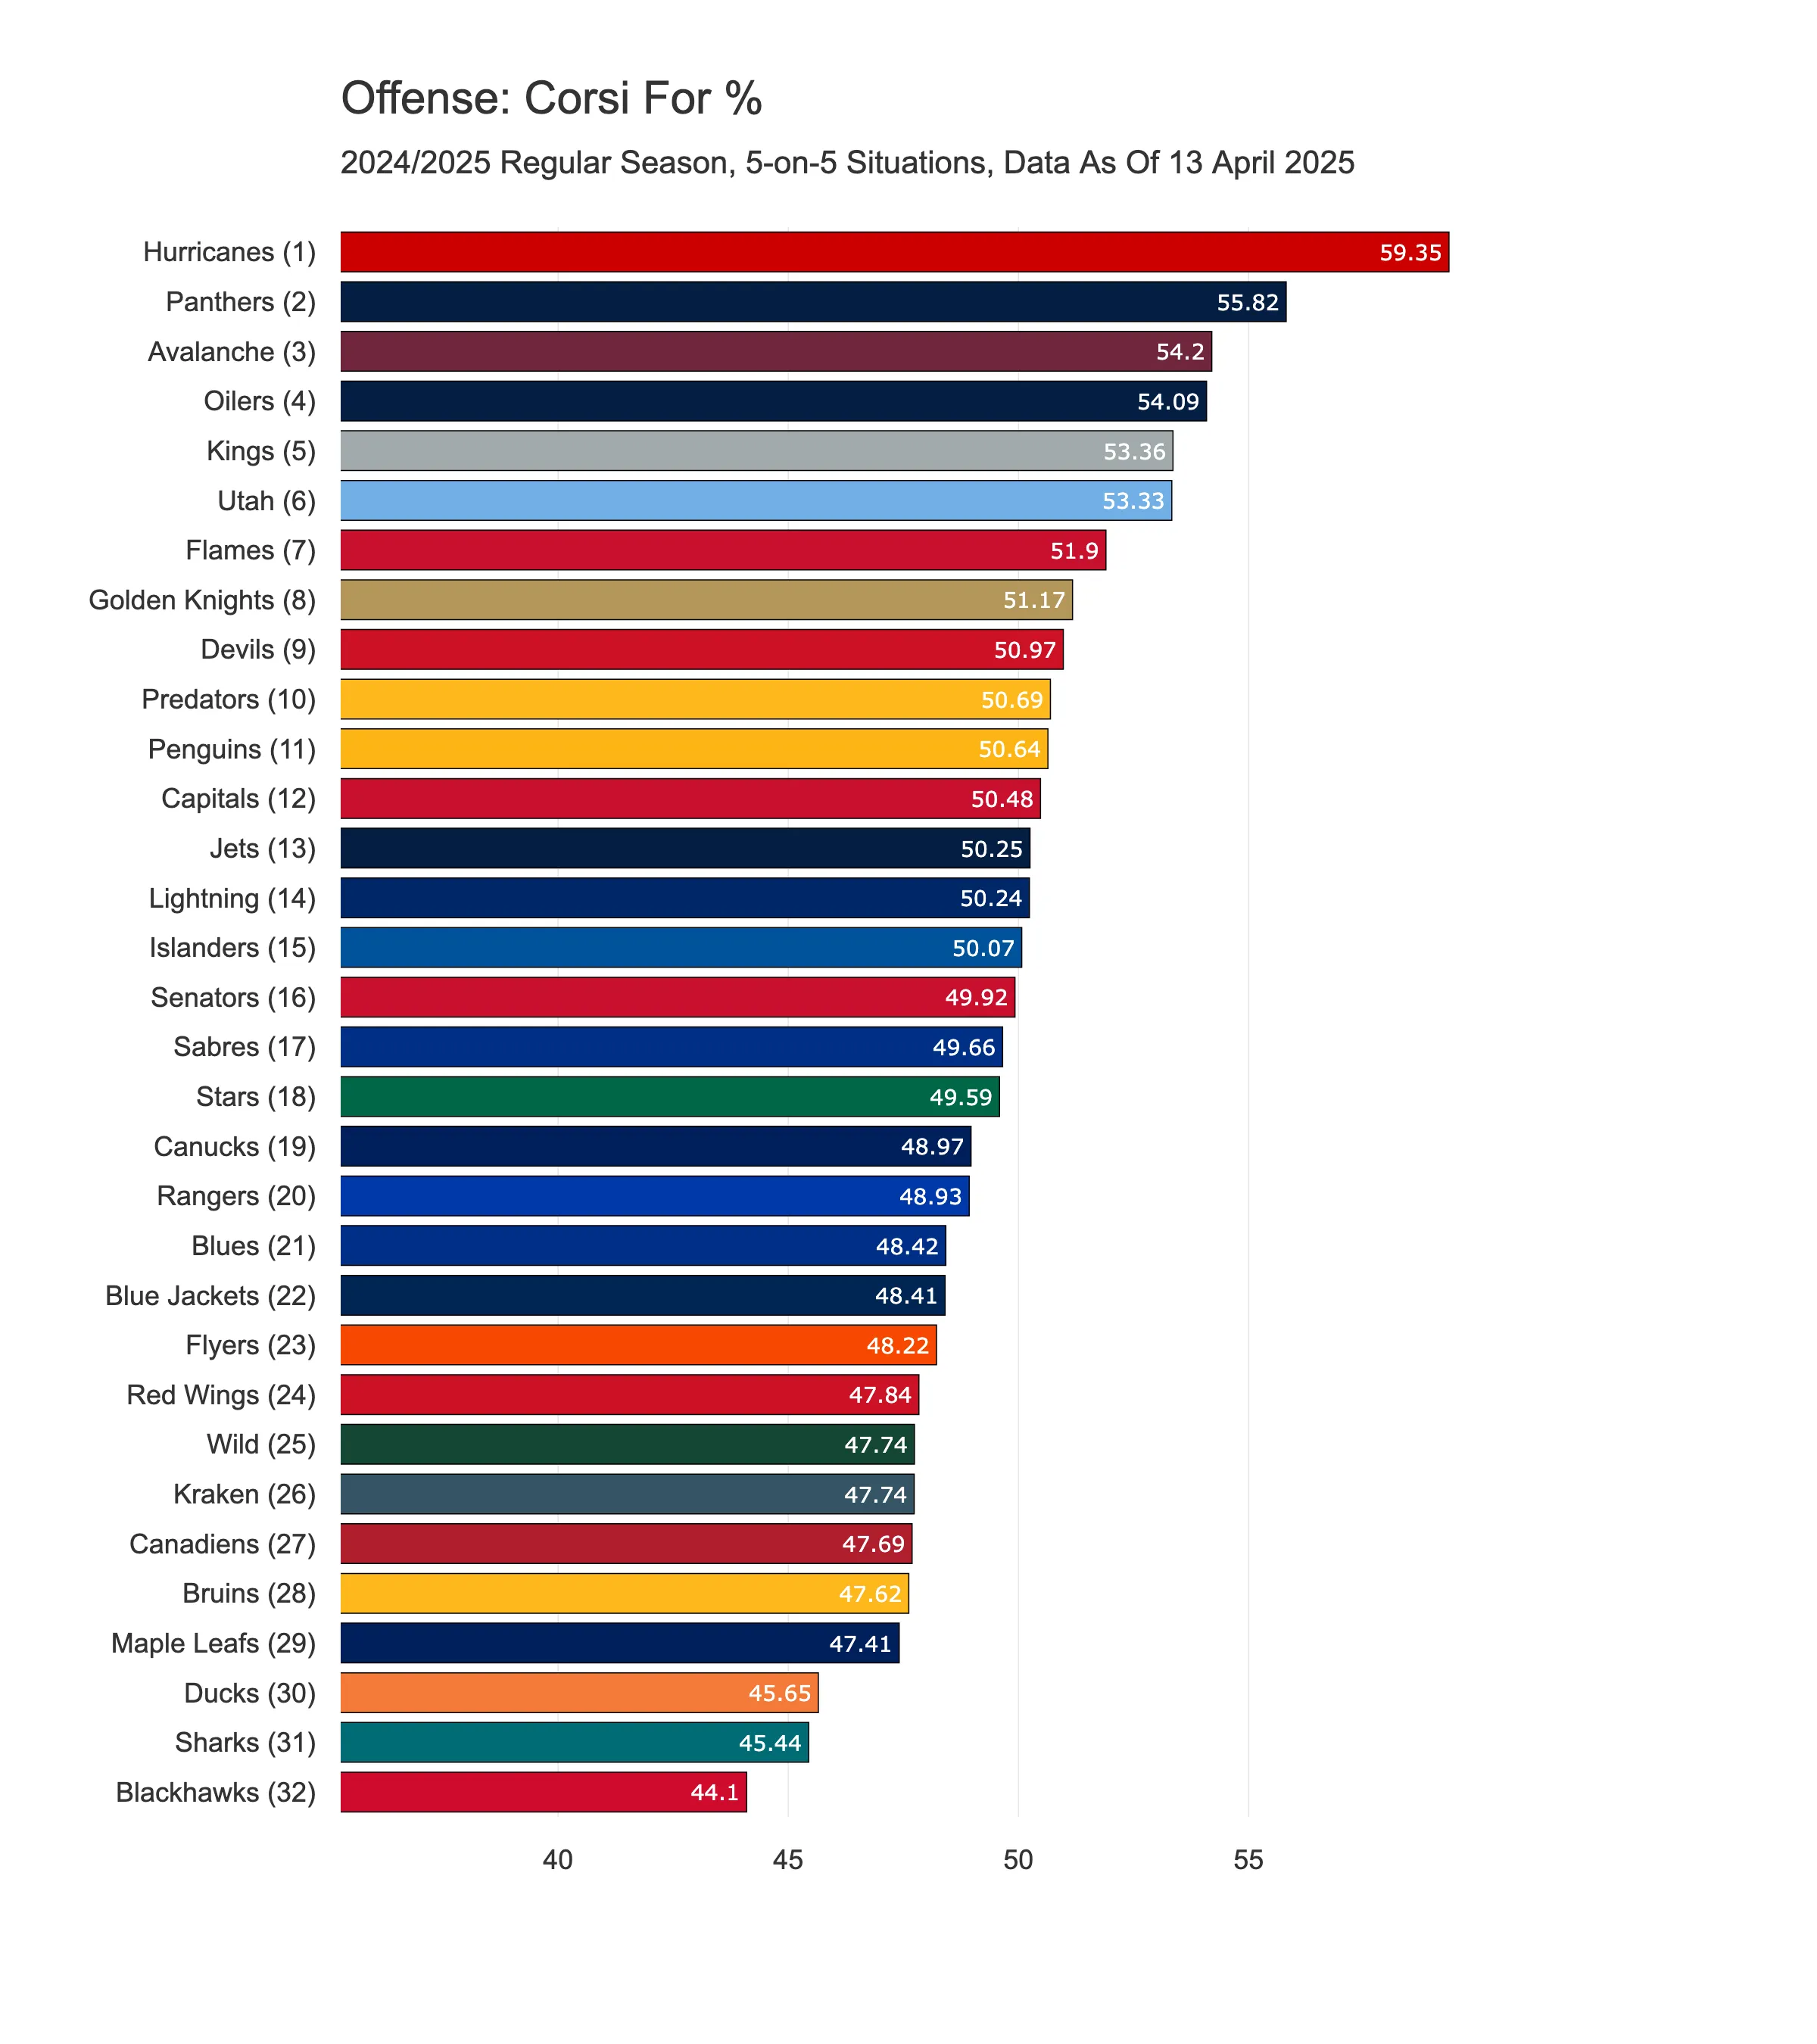
7) Corsi For %
Since there’s no official puck possession stat in hockey—like there is in football, for example—analysts tend to use Corsi instead. It’s a proxy for puck possession and is typically interpreted as the percentage of total shot attempts (for and against) taken by a team. So, teams that control the play and take more shots than they concede will have a Corsi value above 50%. On the flip side, teams that are regularly outshot by their opponents will sit below 50%, which usually means they don’t have much control over the game.
Although Corsi isn’t strictly an offensive stat (since it reflects both attacking and defending), I’ve chosen to include it in the offensive stats list. That’s because I believe puck possession comes more from offensive skill than defensive effort.
The results aren’t all that surprising. The top two teams are very similar when it comes to both shot volume and quality, and the next two are classic examples of high-powered attacking sides. One surprise, though, is seeing the Maple Leafs down in the 29th place. Honestly, I would’ve expected them to rank much higher—especially based on the overall rankings in the league.
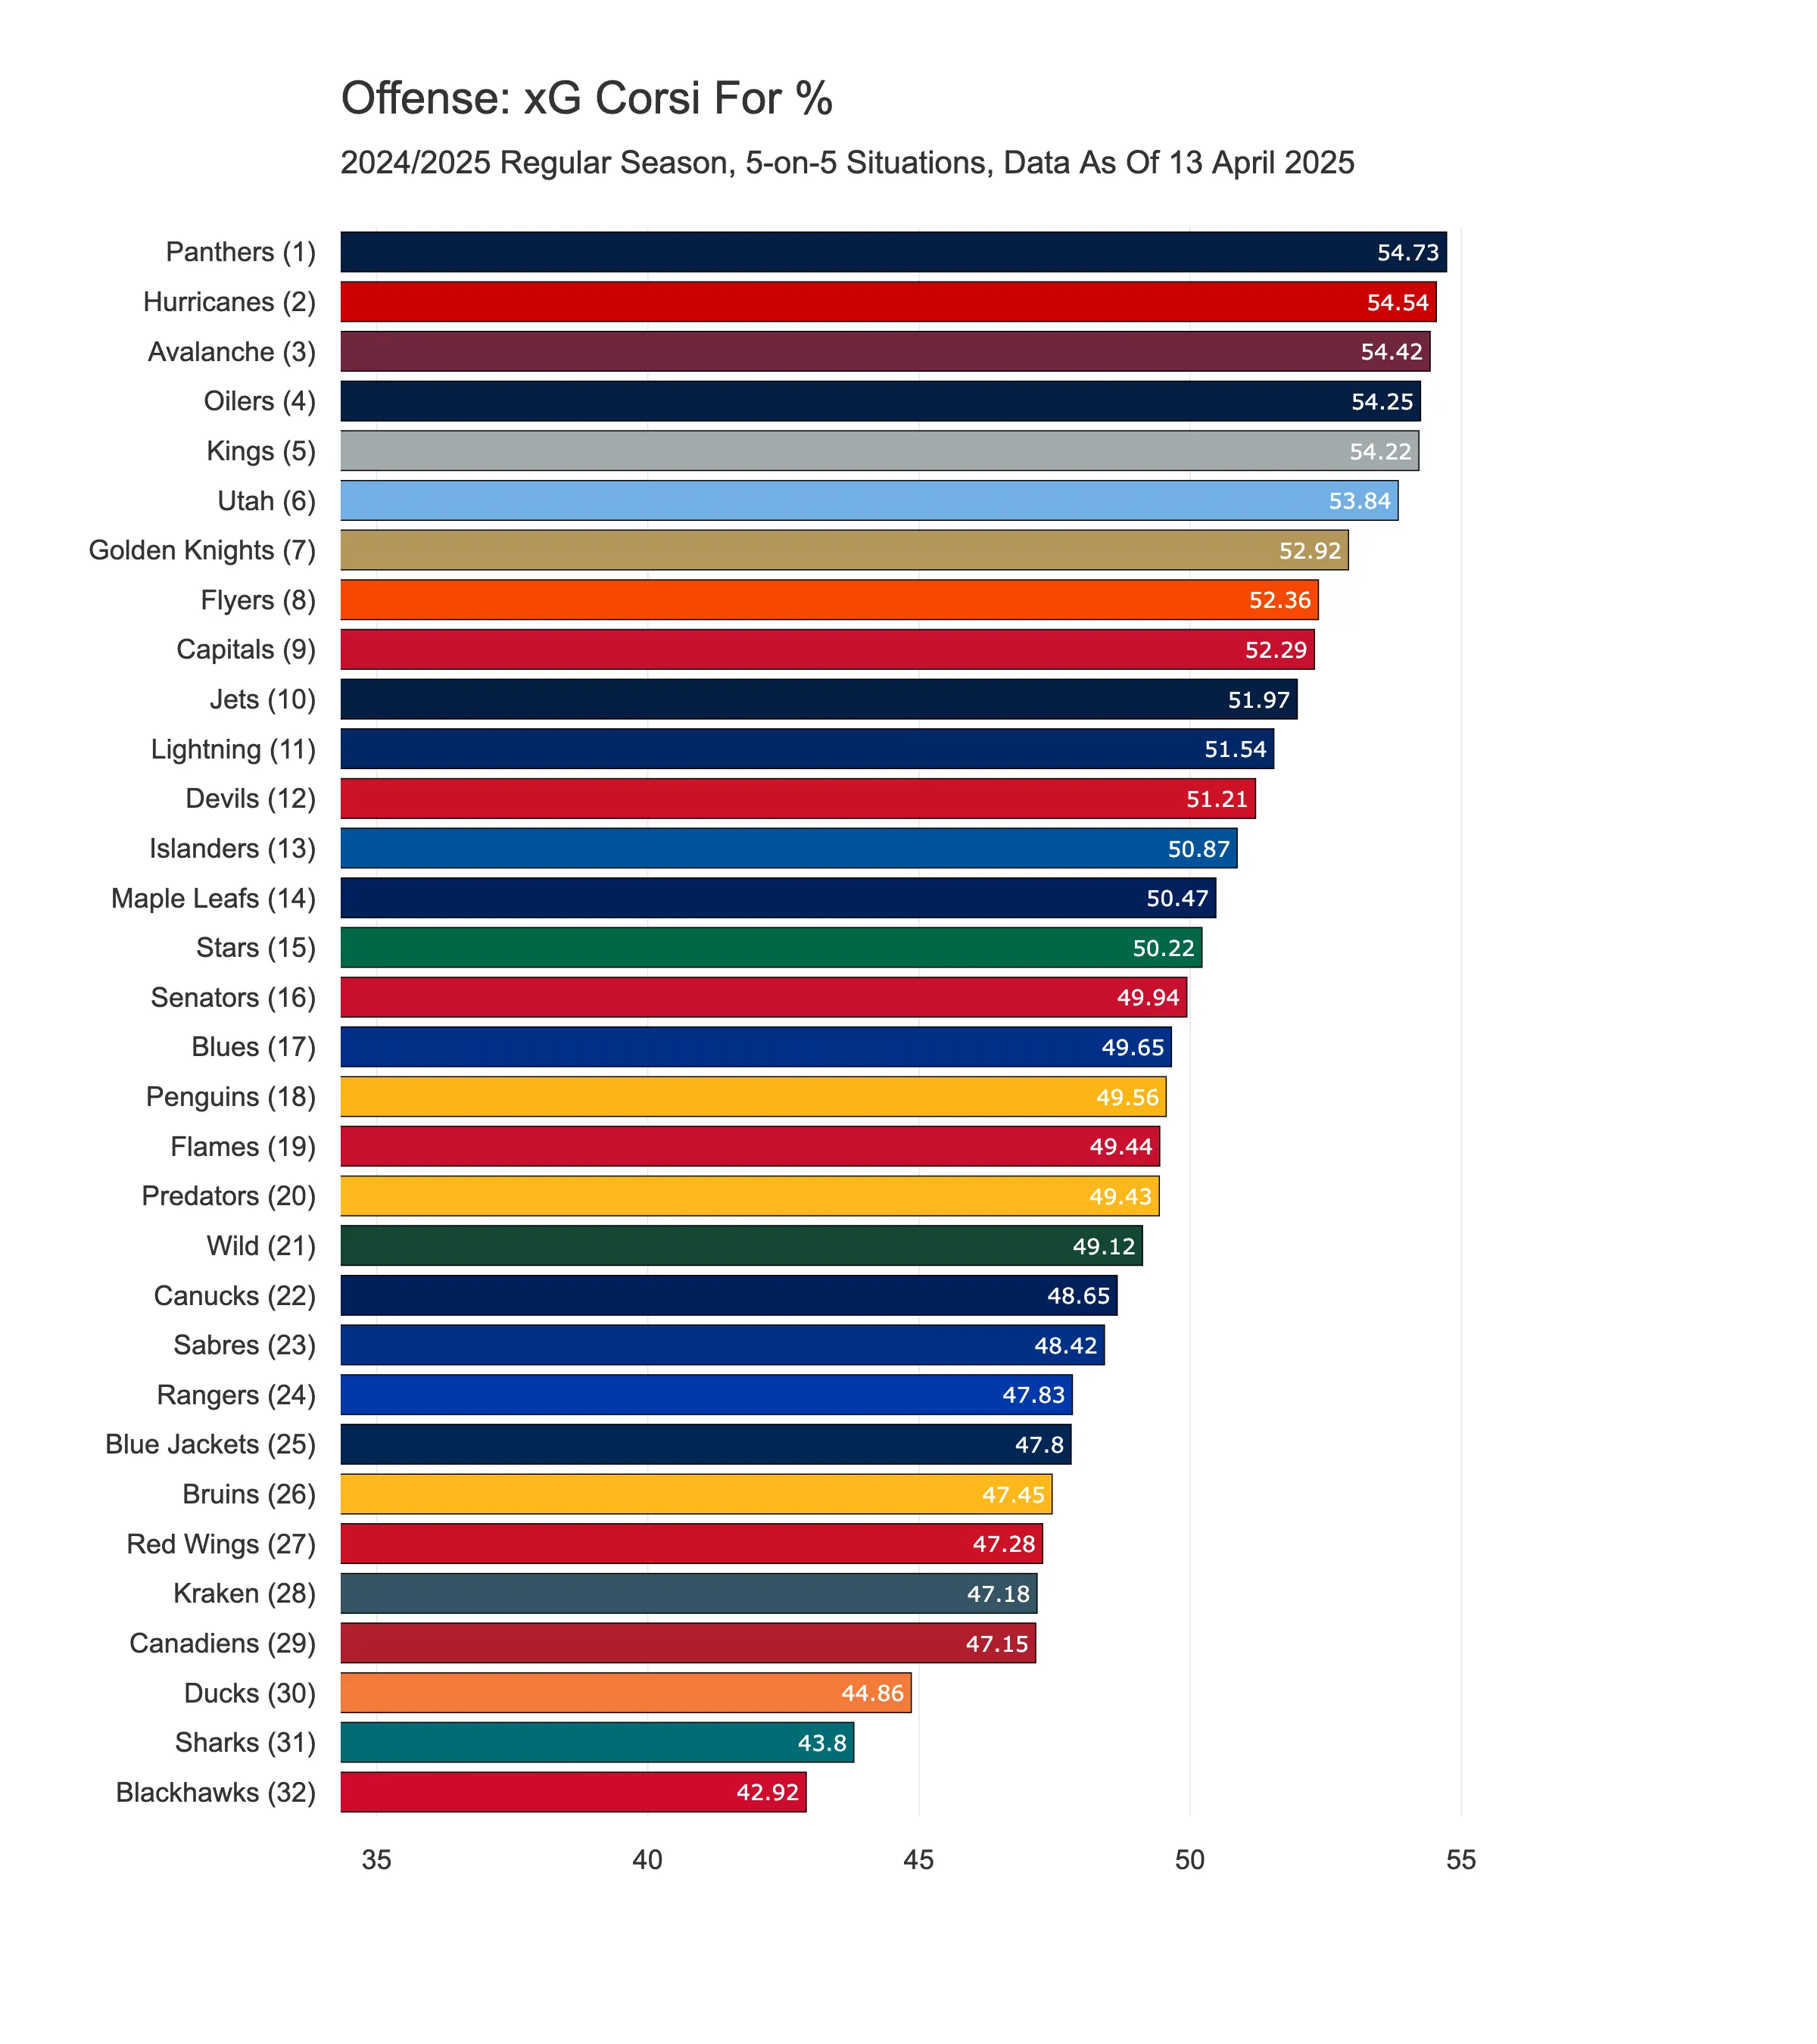
8) xG Corsi For %
A more refined version of Corsi that also accounts for shot quality is xG Corsi For %. While the top three spots remain more or less the same as in case of basic Corsi For %, there’s a noticeable jump in the rankings for the Maple Leafs! They climb from 29th all the way up to 14th, even pushing past the 50% mark. That suggests they’re creating slightly more high-quality chances than they’re giving up—at least in aggregate.
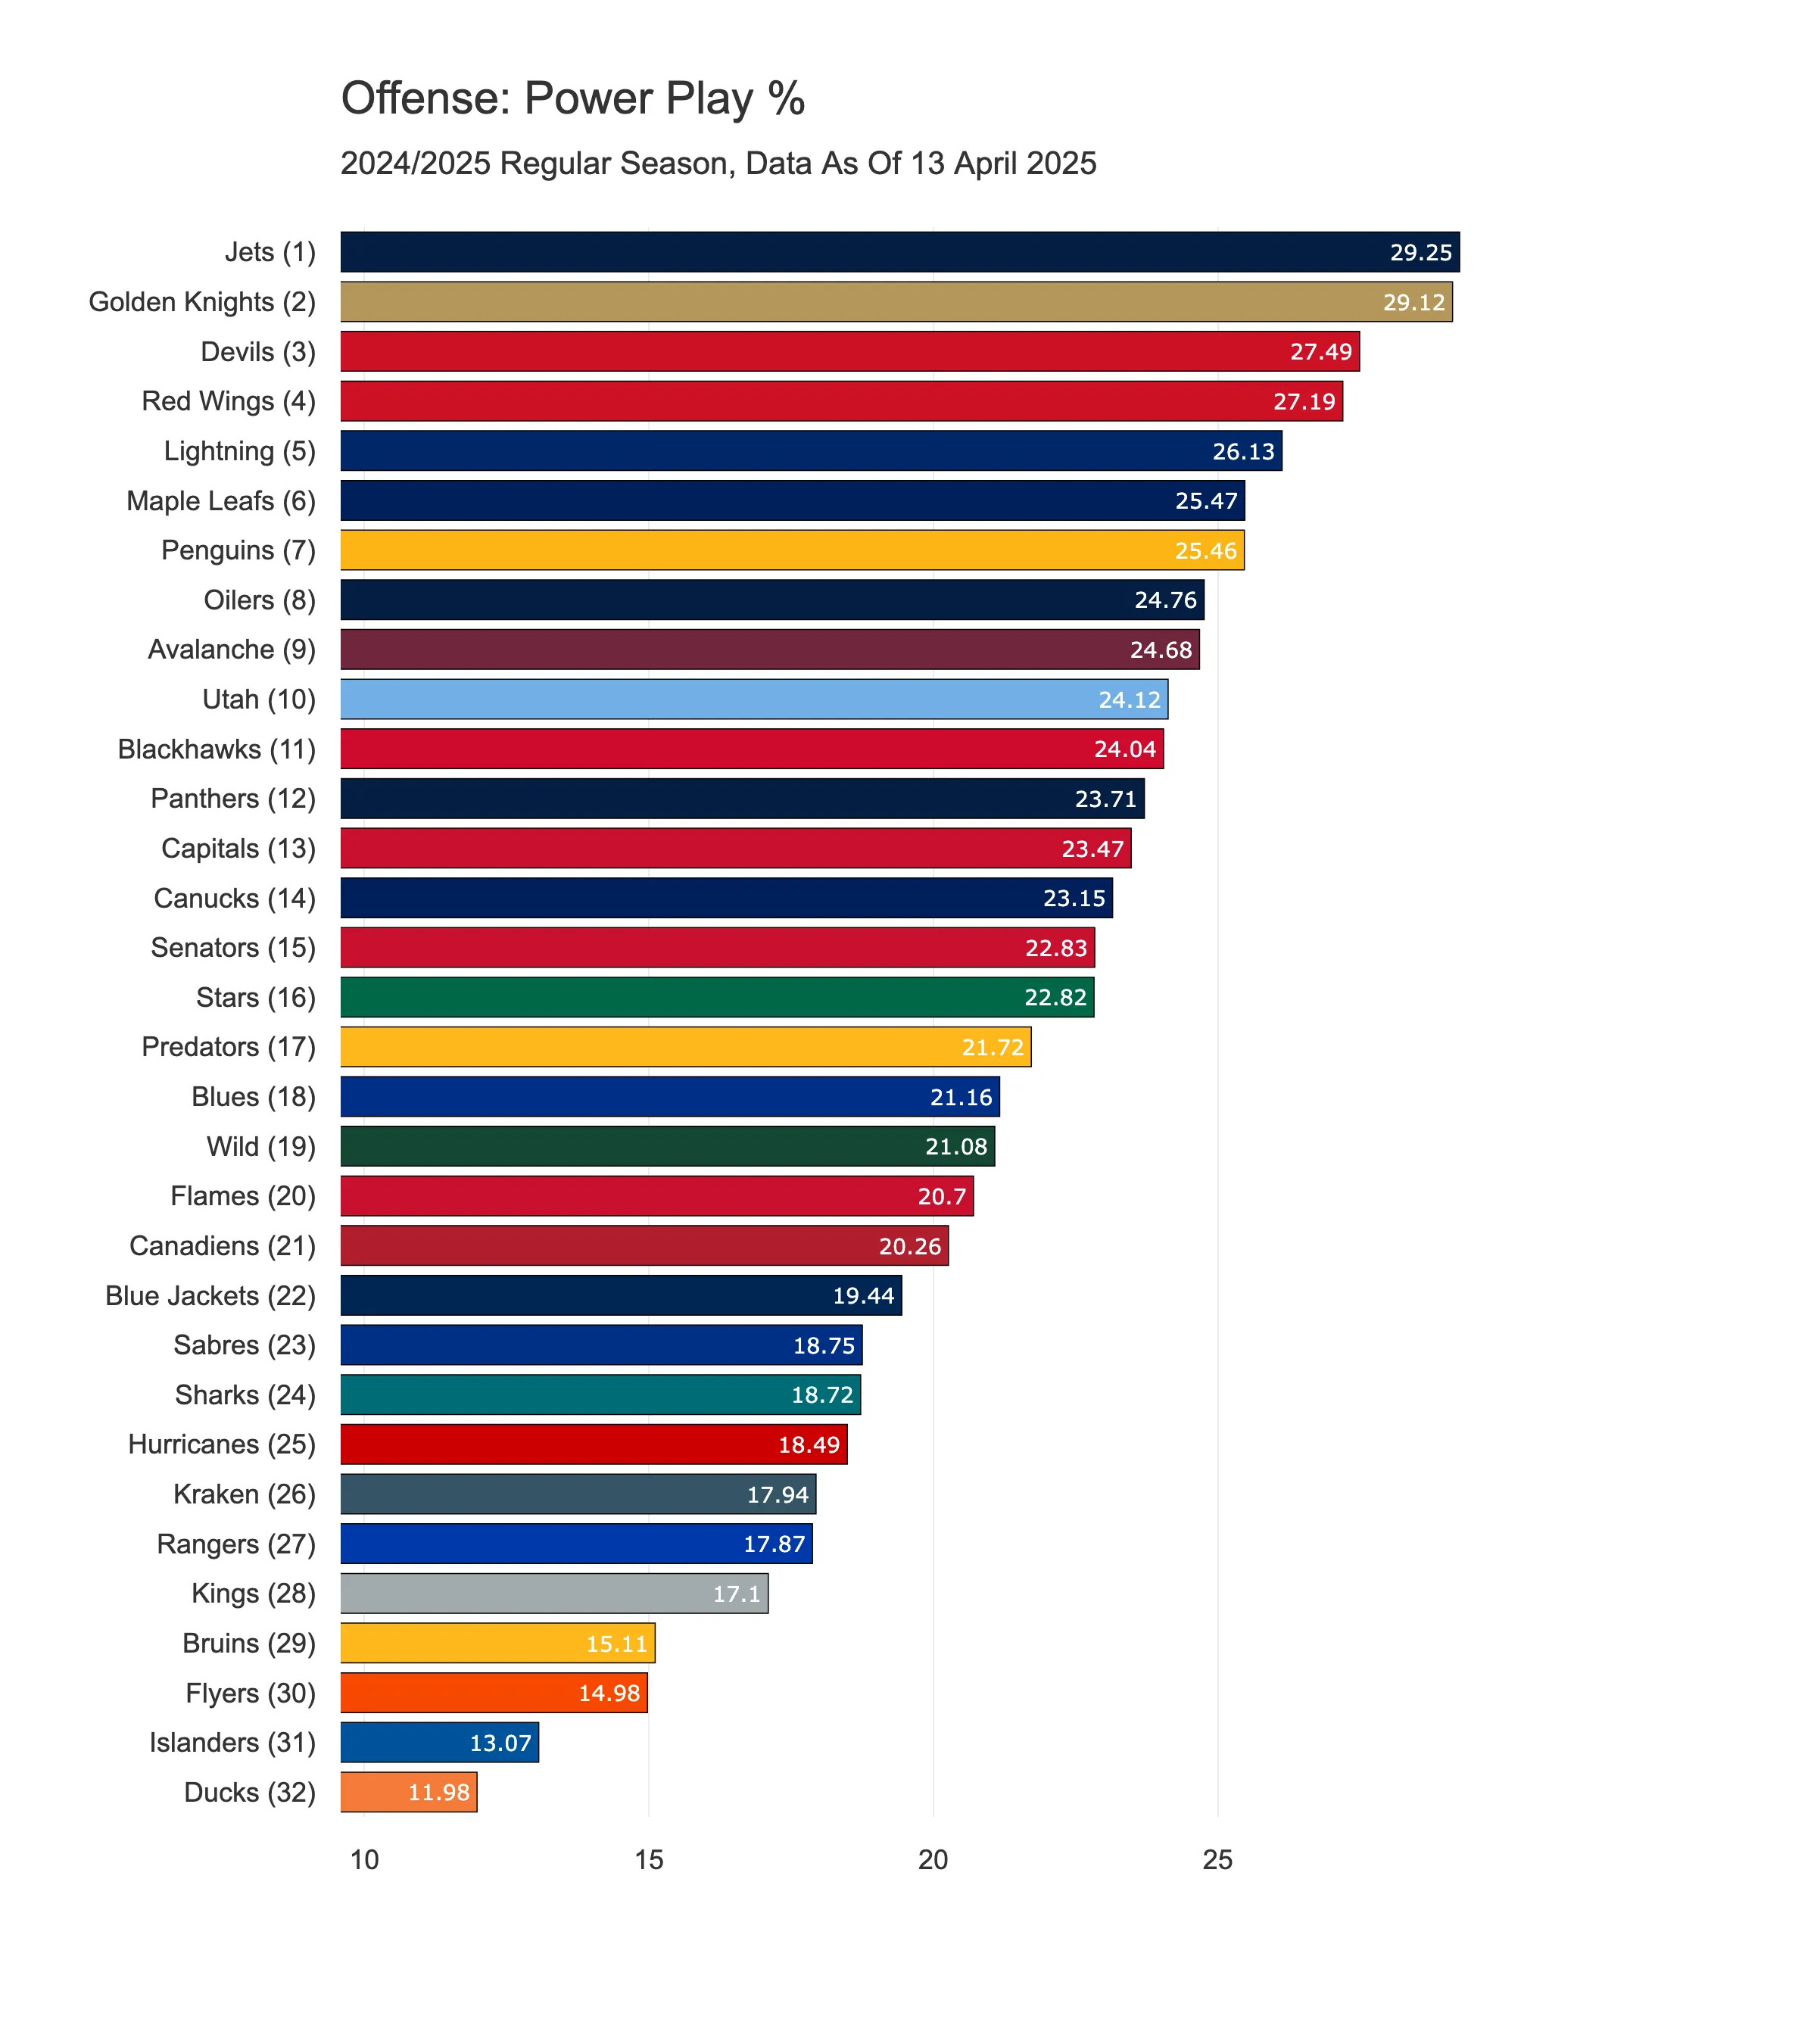
9) Power Play %
This is the only stat that isn’t based on 5-on-5 play, but I decided to include it anyway, as it’s such a big part of a team’s offensive output.
The best teams in the league here are the Jets—winners of the Western Conference—and the Golden Knights, who could count on power-play goals from Czech forward Tomáš Hertl. At the other end of the table, the Ducks, Islanders, and Flyers struggled to make much of an impact with the man advantage.
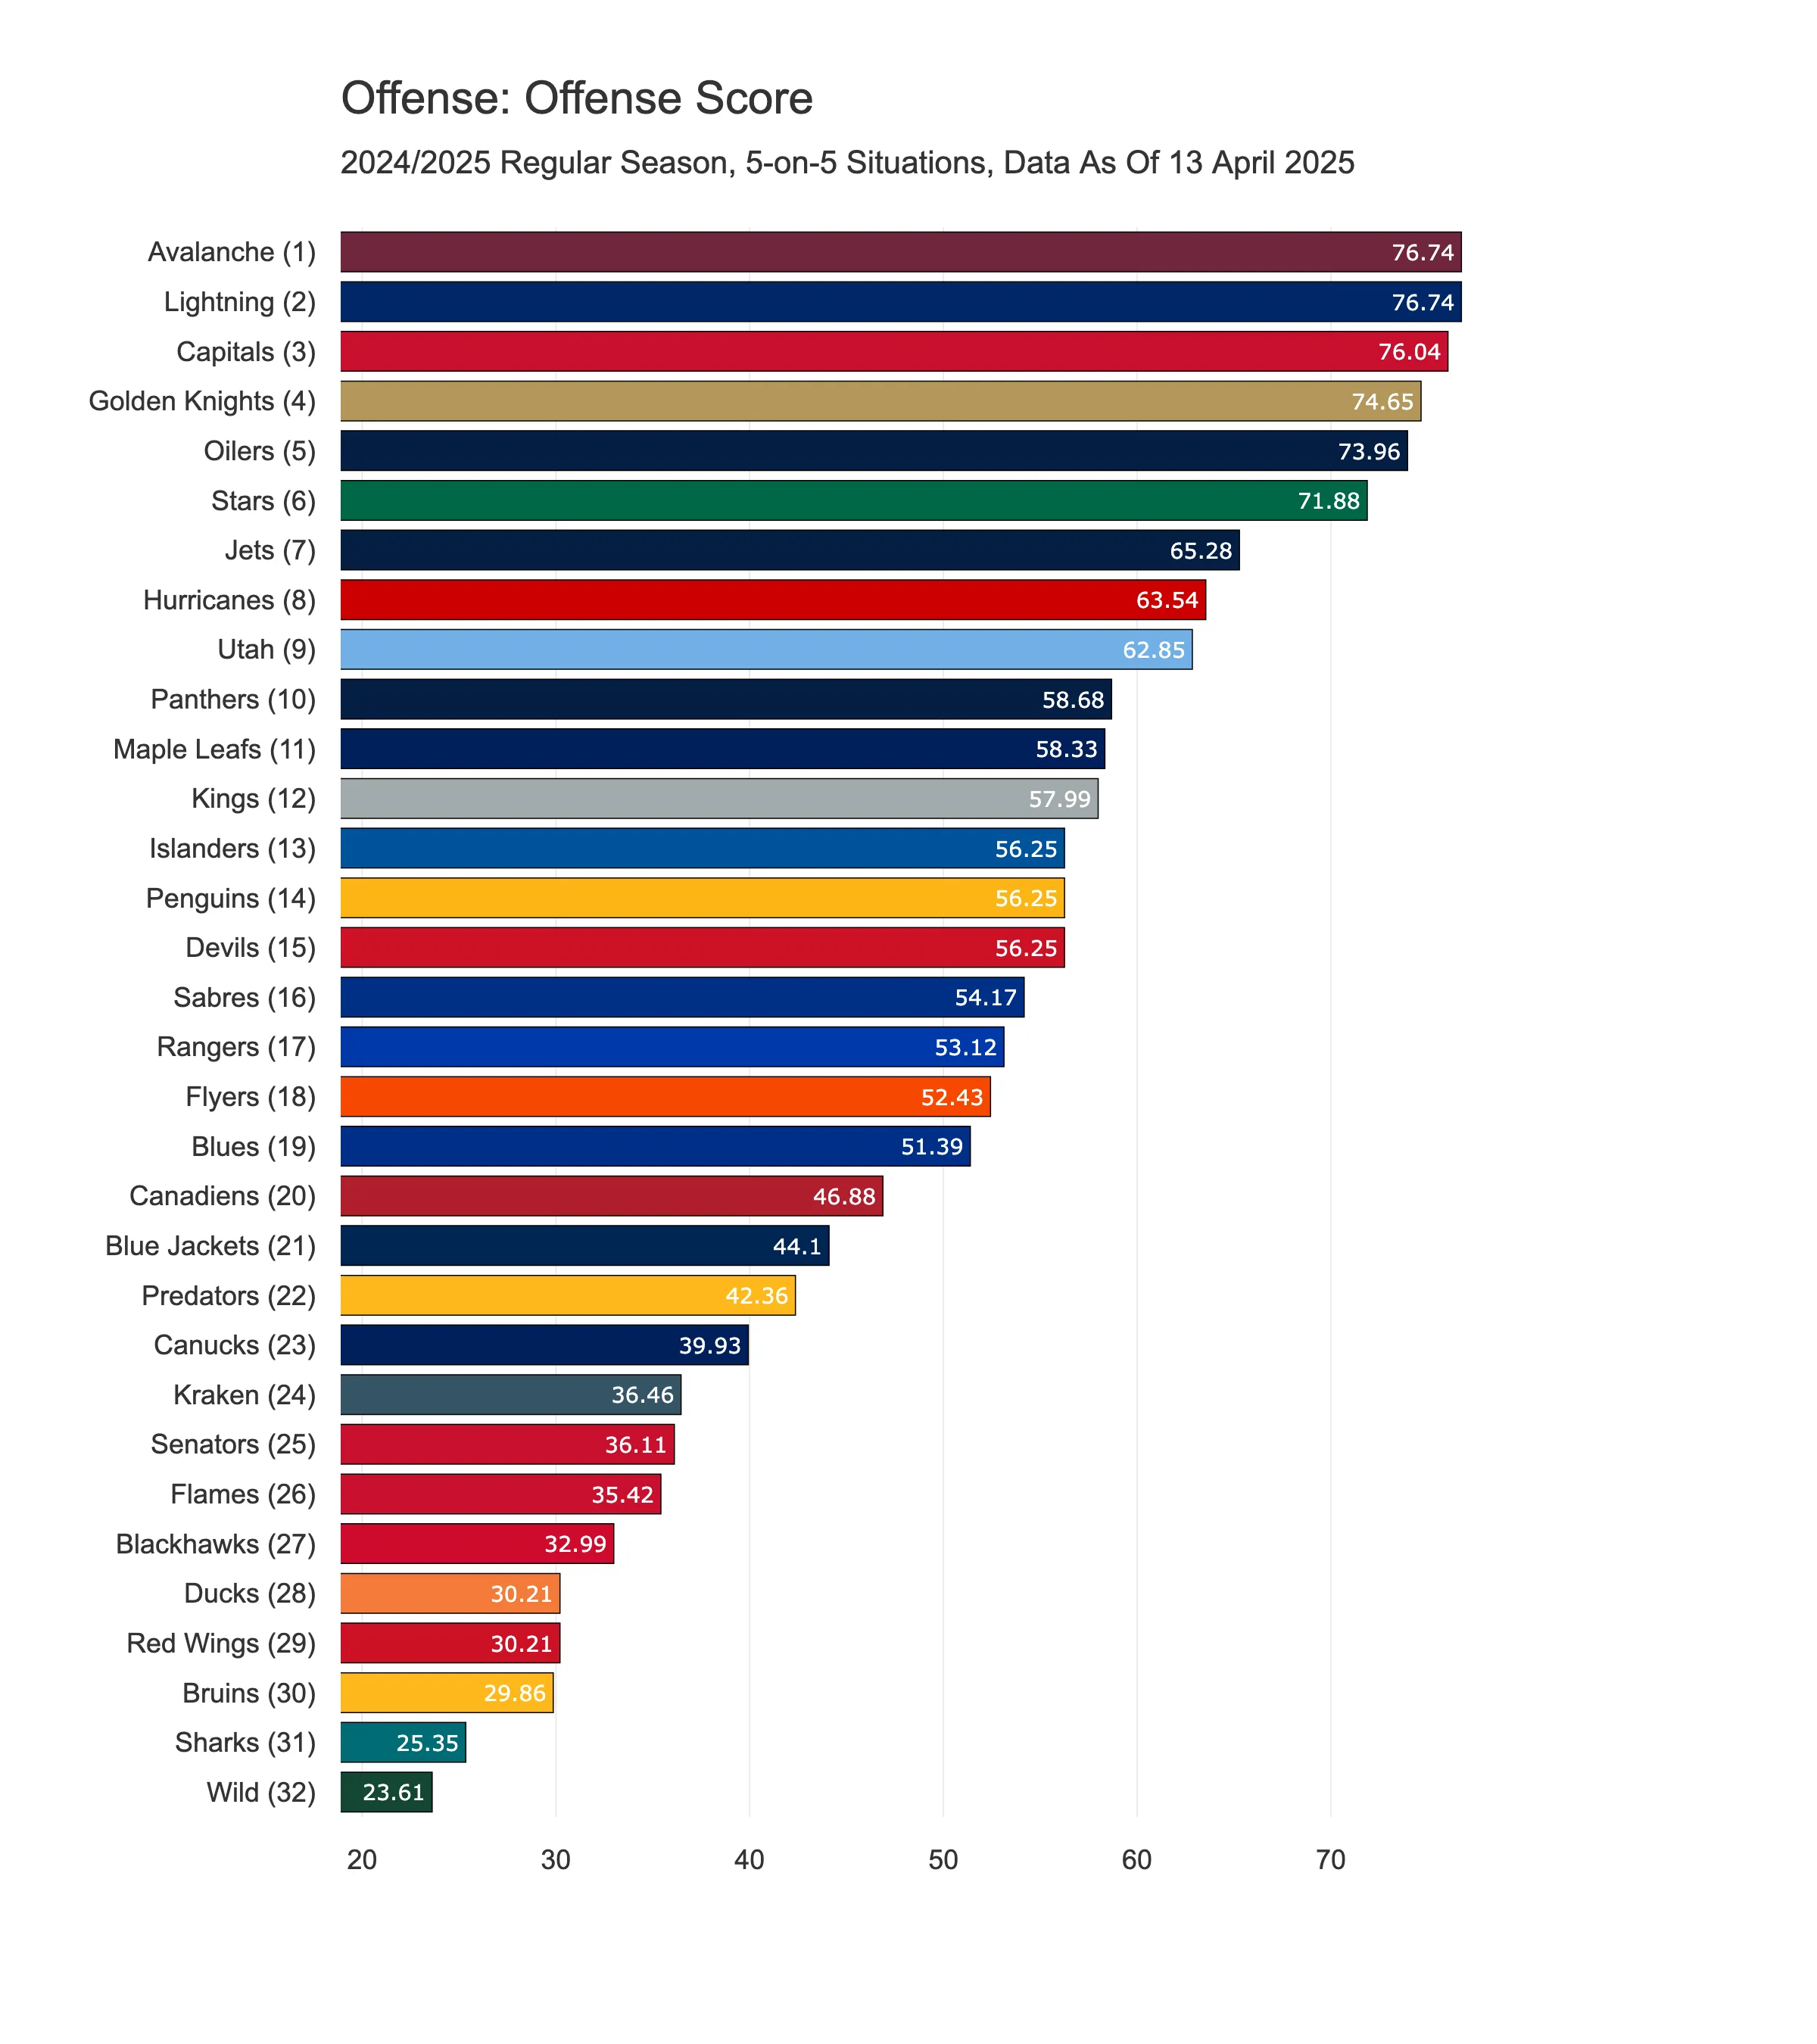
Offensive Rankings: The Best and Worst NHL Teams
Each team was ranked in these nine categories, assigned a percentile score for each, and then averaged to create a final Offense Score.
Key Takeaways
Elite Offenses
Avalanche, Lightning, Capitals, Golden Knights, Oilers, and Stars — these are the six teams that stand out as the most dominant offensive forces in the league.
It’s no surprise to see the Avalanche leading the pack. Despite trading away franchise legend Mikko Rantanen — a move that shocked many fans — they’ve proven it was the right call. They made a few other moves before the trade deadline, and now, with players like MacKinnon, Makar, Nečas, Nelson, Nichushkin, and Coyle in the lineup, they look like an absolute beast.
In the shared first place are the Lightning, who’ve had a solid season. With strong performances from Kucherov, Hagel, and Point, they’ve hardly felt the absence of their former captain, who’s now with the Predators. Tampa Bay ranked 5th in goals scored, 20th in total shot creation, 2nd in low-danger shots, 2nd in high-danger chances, and 7th in goals per expected goals. In other words, while they didn’t pepper the net as much as some teams, the chances they did create were high quality — and they made them count.
The Oilers are a particularly interesting case. They sit 5th overall, but their underlying stats are all over the place. Their goal tally was middling, and they ranked among the worst in goals per xG. However, they were excellent in puck possession metrics and high-danger shot creation. That suggests they consistently outplayed their opponents and got into good scoring positions, but struggled to convert the chances into goals.
Struggling Teams
Wild, Sharks, and Bruins - these were the three teams that finished as the league’s weakest offensively.
The Wild were a surprise. Yes, they were without their star player Kirill Kaprizov for most of 2025 and couldn’t rely on his goals and assists—but even so, I wouldn’t have expected them to have the worst offence in the entire league, especially for a team still in the playoff hunt with a decent chance of making it. But looking at the individual stats, they came up short across the board. They ranked 29th in goals scored, 24th in shot volume, dead last (32nd) in low-danger shots, 27th in high-danger shots, and 22nd in goals per xG. Their possession numbers were also well below average. And yet, they’re still in the playoff race. Some might call it luck, but I wouldn’t. From my point of view, they simply rely on other aspects of the game—namely defence and goaltending. But we will get to that later.
The Sharks tell a similar story, but with one major difference: we expected it. No one thought San Jose would set the world on fire this year. Still, while their offence was far from impressive, there’s plenty of promise in players like Celebrini, Smith, and Eklund. Add to that four first-round picks over the next two years, and it looks like they’re laying the foundations for a potentially dangerous offence in the near future.
The Bruins are probably the biggest shock of the three. While fans didn’t exactly have sky-high expectations going into the season, I doubt anyone thought they’d end up bottom of the Eastern Conference. They actually started off fairly well, but things went downhill after New Year. The trade deadline didn’t help either—top players like Brad Marchand and Charlie Coyle were moved on, and the team came dangerously close to setting a franchise record for the longest losing streak. Put like that, it’s almost hard to believe David Pastrňák still managed to hit the 100-point mark this year.
Final Thoughts: Does Offense Translate to Winning?
One of the most interesting comparisons is seeing how offensive performance correlates with the actual league standings. While top-ranked offensive teams generally perform well in the standings, some exceptions emerge:
- Utah are ranked 9th in Offence Score but are outside the playoff picture. This could point to problems with finishing. Looking at the breakdown, they’re strong in puck possession and shot volume, but seem to struggle when it comes to turning those chances into goals.
- The Senators rank 25th in Offence Score, yet sit 14th in the league standings and they are preparing for the playoffs. This suggests they might be struggling offensively, but are managing to win games through solid defending and goaltending.
Offensive dominance is a strong indicator of success, but it’s not the only factor. While teams with elite scoring ability often go far, balance across all aspects of the game is key. In the next articles, I’ll break down defensive and goaltending rankings to see how well-rounded each team truly is.
Stay tuned for the next part of this analysis, where we explore which teams excel at shutting down opponents!